Market Terminal
Delta-Neutral Positions Explained With Option Chain Data
8 min read · Updated 2 Nov 2026
A delta-neutral position combines options (and sometimes futures) so that small moves in the underlying have little net effect, leaving exposure mainly to time decay and implied volatility.
Studying it needs Delta across strikes, which the Option Chain page shows for every strike, down to the minute.
The basic idea
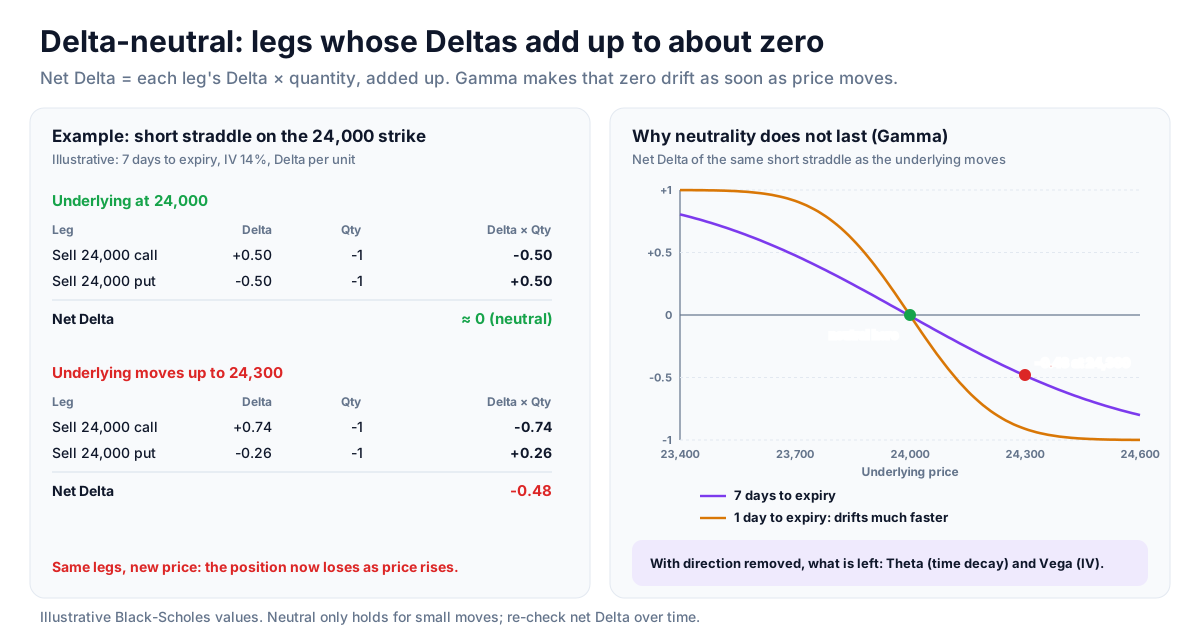
A position is delta-neutral when the Deltas of all its legs add up to roughly zero. For example, an option leg with positive Delta can be offset by another leg with negative Delta, or by an opposite position in the underlying future. The net directional exposure then cancels out, at least for small moves.
Reading the Deltas on the chain
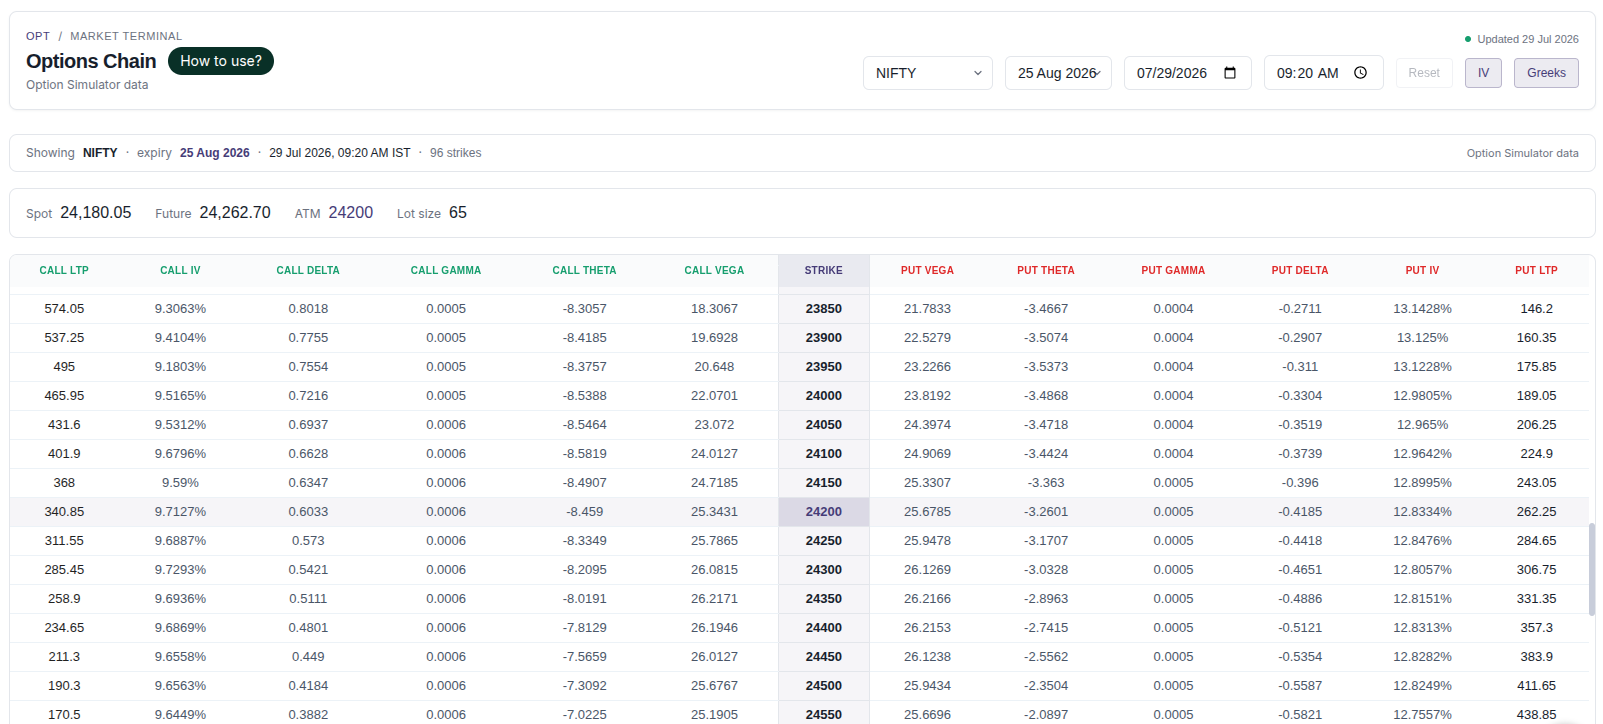
The Call Delta and Put Delta columns give the Delta of each strike for the chosen expiry, and the Spot and Future values in the header confirm the reference price. Multiplying each leg's Delta by its quantity and adding them up shows how close a combination is to neutral at that minute.
Why neutrality does not last
Delta changes as the underlying moves - that is Gamma. A combination that is neutral now drifts away from neutral as price moves, faster for near-ATM and near-expiry strikes (high Gamma) and slower for far or longer-dated strikes. That is why descriptions of these structures note that net Delta has to be re-checked over time. Stepping through a past session on the chain is a practical way to see how quickly that drift happens.
What exposure remains
With direction largely removed, the position's value depends mainly on Theta (time decay) and Vega (changes in implied volatility). That is why delta-neutral structures are usually described as exposed to volatility rather than to price. See option Greeks explained for what Theta and Vega measure.
Strategy ideas (ideas, not promises)
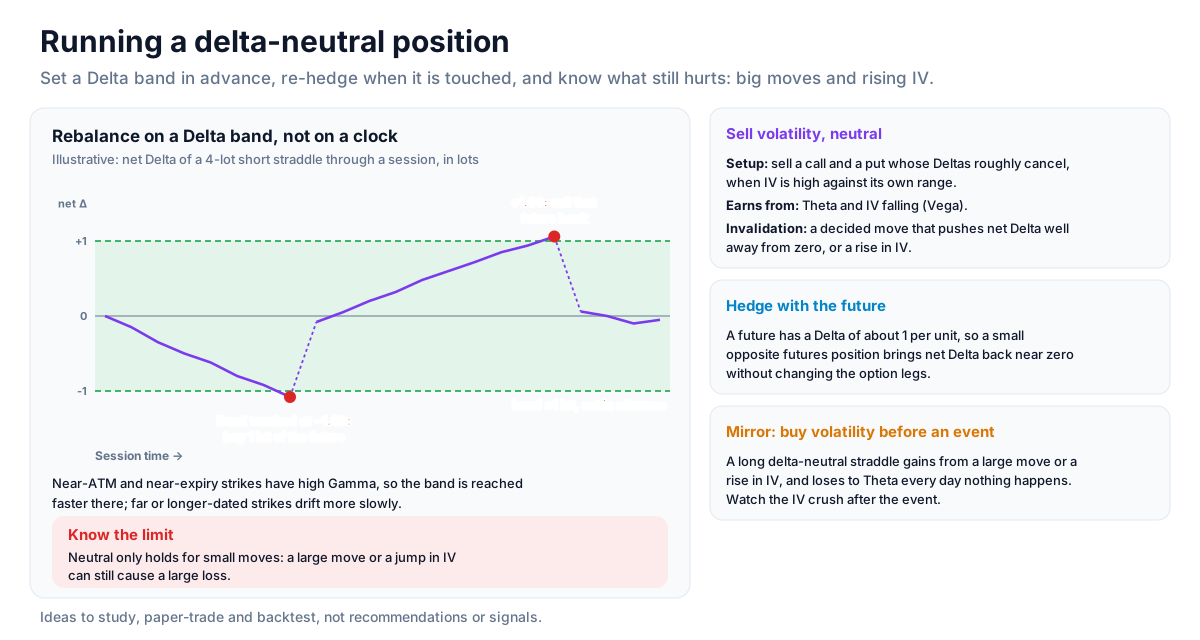
These are ideas to study, paper-trade and backtest, not recommendations or signals, and not a promise of any result. Neutral is only neutral for small moves; a large move or a jump in implied volatility can still cause a large loss. Size, entries, exits and risk are your own decisions.
1. Sell volatility with a neutral straddle or strangle
- Setup: sell a call and a put whose Deltas roughly cancel (for a strangle, similar-size Deltas on each side), when implied volatility looks high.
- Reading: the position earns mainly from Theta and from IV falling (Vega). The IV / HV / IVP page shows whether IV is high against its own range.
- Invalidation: a decided move that pushes net Delta well away from zero, or a rise in IV.
2. Rebalance on a Delta band, not on a clock
- Setup: decide in advance how far net Delta may drift before you re-hedge.
- Reading: near-ATM and near-expiry strikes have high Gamma, so the band is reached faster there; far or longer-dated strikes drift more slowly.
3. Hedge with the future
- Setup: an options position with net Delta away from zero.
- Reading: a future has a Delta of about 1 per unit, so a small opposite futures position can bring the total back near zero without changing the option legs.
4. Buy volatility before an event
The mirror case: a long, delta-neutral straddle profits from a large move or a rise in IV, and loses to Theta every day nothing happens. Watch the IV crush after the event.
How to test these
Step through past sessions on the Option Chain, add up each leg's Delta × quantity at a few times in the day, and see how fast the combination drifts. The Options Simulator and the backtester can then show how such a structure would have done.
Where to go next
Read IV and straddles/strangles next, or return to the derivatives data guide. Try the Option Chain free.
How to Read This Data
An option chain lists every call and put for an expiry by strike price, with open interest, volume, price, implied volatility (IV) and the Greeks. It is the standard way to study how options are priced and where positions are concentrated.
- Locate the at-the-money strike; strikes closer to it usually have higher volume and tighter bid-ask spreads.
- Read IV across strikes to see how the market prices expected movement (often called the volatility smile or skew).
- Compare open interest across strikes to see where positions are concentrated.
- Read the Greeks to understand sensitivity: delta to price, theta to time, vega to volatility.
Limitations: Option prices and Greeks change continuously. A historical chain shows one moment in time, and open interest does not reveal whether positions are hedged.
More from the blog
- Strategy Backtesting on Unfluke
Backtest trading strategies on real Indian market data with Unfluke. Test equity, Nifty, Bank Nifty and options strategies with realistic costs and key metrics.
- Live Market Scanners
Explore Unfluke's real-time stock scanner for NSE markets. Scan 1,800+ stocks with 40+ technical indicators, fundamental filters, F&O data and custom rules.
- Option Strategy Simulator
Build and simulate multi-leg options strategies with Unfluke. Visualize payoffs, Greeks, max profit and loss, and replay historical option data from 2023.