Market Terminal
Implied Volatility, Straddles and Strangles Explained
8 min read · Updated 2 Nov 2026
Straddles and strangles are option structures whose outcome depends heavily on implied volatility (IV) - how much movement the market is already pricing in.
The Call IV and Put IV columns on the Option Chain page, read across strikes and against the calendar of known events, are the main inputs for studying them.
Why IV matters more than the premium alone
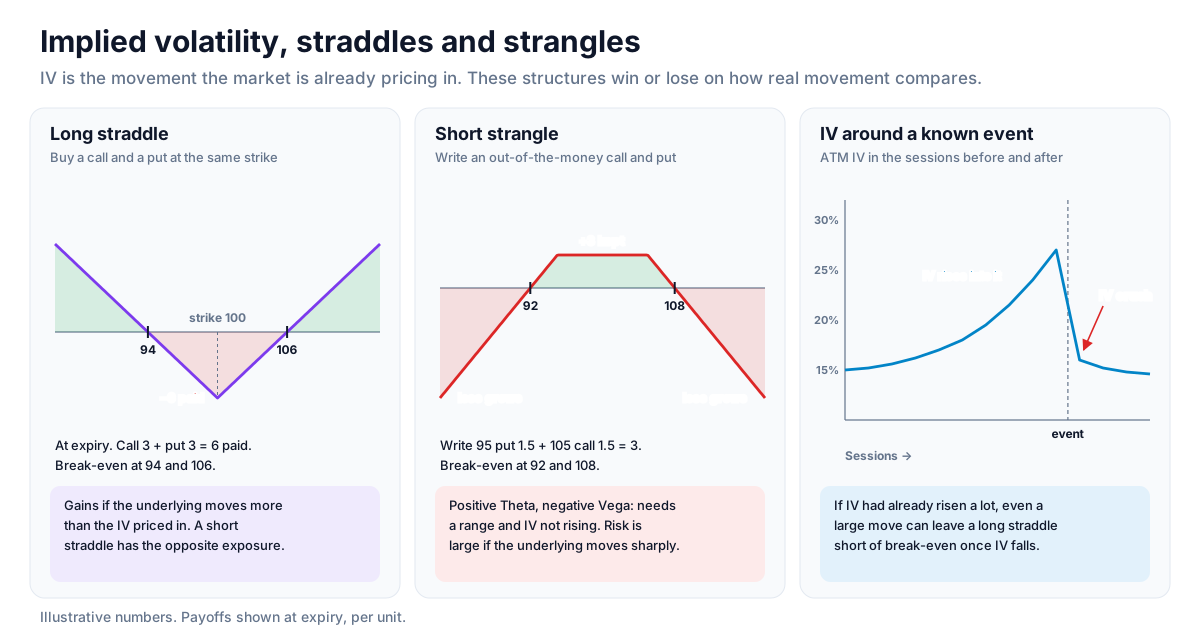
A long straddle (a call and a put at the same strike, both held) gains in value if the underlying moves more than the current IV implies; a short straddle has the opposite exposure. That is why the size of the premium on its own says little - what matters for understanding either structure is how IV compares with the movement that actually follows.
IV around known events - and IV crush
IV often rises ahead of a known event such as quarterly results and falls sharply once the news is out - an effect called IV crush. The Result Calendar gives the scheduled dates, and the Option Chain's date and time pickers let you compare IV in the sessions before a past event with IV right after it.
Long straddles and IV before an event
Analysts studying long straddles typically look at whether IV had already risen a lot before the event. If it had, the premium already reflects much of the expected move, so even a large move can leave the structure short of break-even once IV falls.
Short strangles and their risk
A short strangle (an out-of-the-money call and put, both written) has positive Theta and negative Vega: its value to the writer depends on the underlying staying within a range and IV not rising. Its risk is large if the underlying moves sharply, which is why textbooks examine it through its defined-risk variants and a full Greeks read rather than IV alone.
Strategy ideas (ideas, not promises)
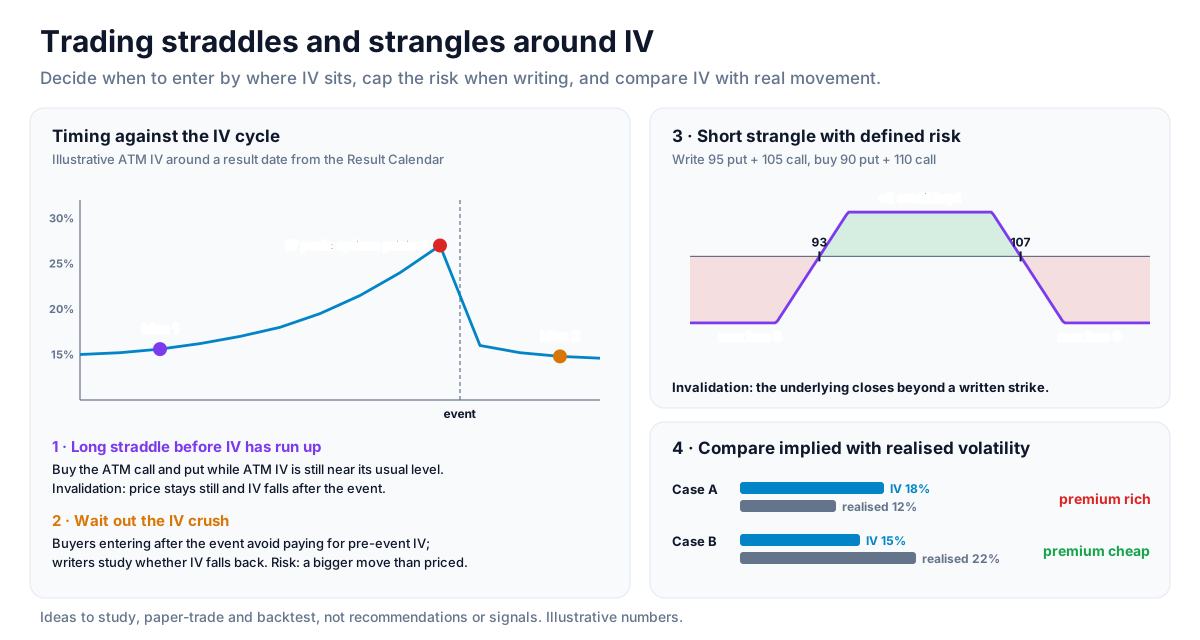
These are ideas to study, paper-trade and backtest, not recommendations or signals, and not a promise of any result. Straddles and strangles live or die on how actual movement compares with implied volatility; a short strangle can lose far more than the premium collected. Size, entries, exits and risk are your own decisions.
1. Long straddle before IV has run up
- Setup: a known event on the Result Calendar, with ATM IV still near its usual level.
- Entry idea: buy the ATM call and put before IV has already climbed.
- Invalidation: the underlying stays still and IV falls after the event: both legs lose value.
2. Wait out the IV crush
- Setup: IV that rose sharply into an event.
- Reading: option buyers who enter after the event avoid paying for the pre-event IV; writers study whether IV falls back once the news is out.
- Risk: a move larger than the market priced, which hurts writers whatever IV does.
3. Short strangle with defined risk
- Setup: a range-bound underlying with IV that is high against its own history.
- Idea: write an out-of-the-money call and put and buy further strikes on both sides, so the worst loss is capped.
- Invalidation: the underlying closing beyond a written strike.
4. Compare implied with realised volatility
- Reading: if the underlying's actual moves have been smaller than IV implies, premium is rich; if larger, premium is cheap. The IV / HV / IVP guide covers this comparison.
How to test these
Use the Option Chain's date and time pickers to compare ATM IV before and after past results, then backtest the straddle or strangle on Unfluke's backtester across many events, not just one.
Where to go next
Read put call ratio explained for a sentiment view, or return to the derivatives data guide. Try the Option Chain free.
How to Read This Data
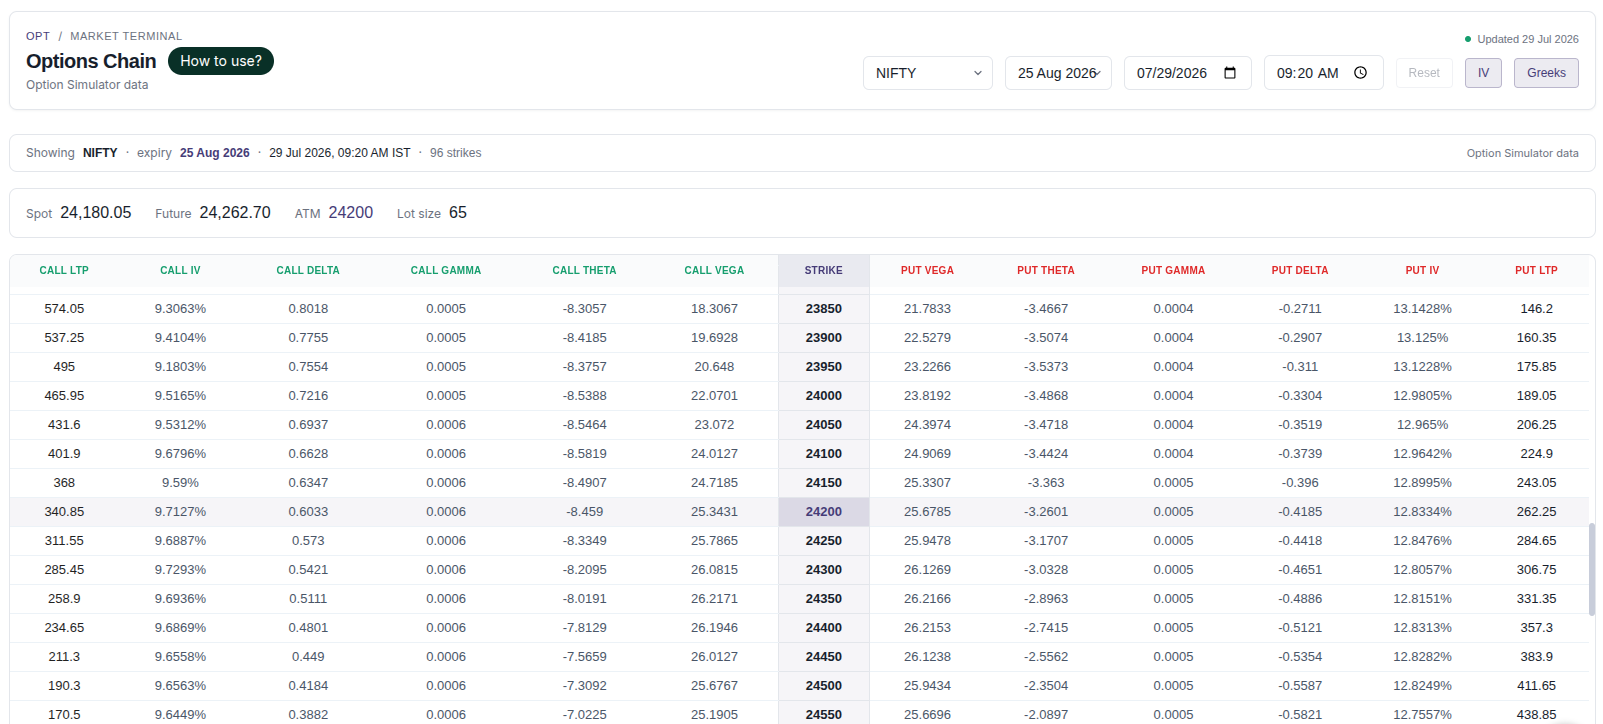
An option chain lists every call and put for an expiry by strike price, with open interest, volume, price, implied volatility (IV) and the Greeks. It is the standard way to study how options are priced and where positions are concentrated.
- Locate the at-the-money strike; strikes closer to it usually have higher volume and tighter bid-ask spreads.
- Read IV across strikes to see how the market prices expected movement (often called the volatility smile or skew).
- Compare open interest across strikes to see where positions are concentrated.
- Read the Greeks to understand sensitivity: delta to price, theta to time, vega to volatility.
Limitations: Option prices and Greeks change continuously. A historical chain shows one moment in time, and open interest does not reveal whether positions are hedged.
More from the blog
- Strategy Backtesting on Unfluke
Backtest trading strategies on real Indian market data with Unfluke. Test equity, Nifty, Bank Nifty and options strategies with realistic costs and key metrics.
- Live Market Scanners
Explore Unfluke's real-time stock scanner for NSE markets. Scan 1,800+ stocks with 40+ technical indicators, fundamental filters, F&O data and custom rules.
- Option Strategy Simulator
Build and simulate multi-leg options strategies with Unfluke. Visualize payoffs, Greeks, max profit and loss, and replay historical option data from 2023.