Market Terminal
Earnings Quality: Cash Conversion, Accruals and Seven Red-Flag Checks for NSE Companies
10 min read · Updated 9 Nov 2026
Profit is an accounting number. A company can book a sale today and collect the cash months later, or never; it can count a one-off gain or interest on its cash pile as profit. None of that is wrong, but it means two companies with the same profit can have very different businesses underneath. Cash is harder to dress up, so the gap between profit and cash is where analysts look first.
The Earnings Quality page runs seven checks on every listed non-financial company's latest annual accounts and grades each from A to D. This guide explains each check and its thresholds, reads real rows from 6 November 2026 (BEL with three red flags, Asian Paints with none, and a few surprising ones), and shows how to use the grade without mistaking it for a verdict.
What earnings quality is, and the seven checks
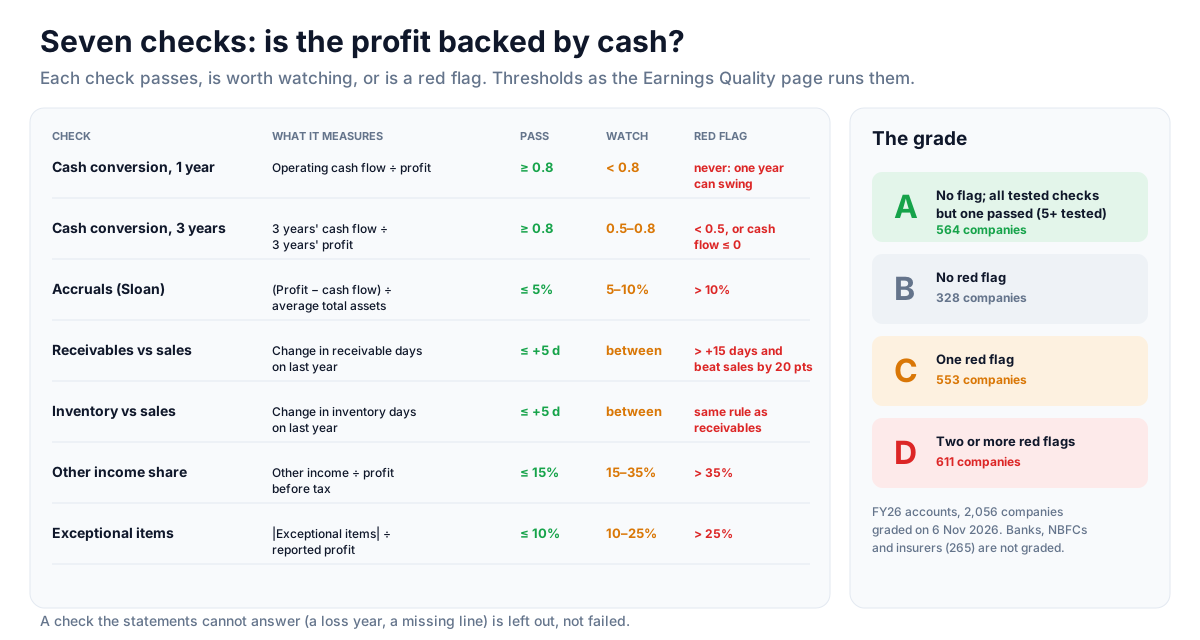
"Earnings quality" means how well reported profit reflects cash the business actually earned, and how likely it is to repeat. The idea has a long research history. Richard Sloan (1996) showed that US companies whose profit ran far ahead of their cash flow (high accruals) tended to have weaker profits, and weaker share prices, in the years after. The page turns that idea, and a few standard analyst checks, into seven tests.
Net profit here is adjusted net profit (reported profit less extraordinary items), the same figure Quality Scores uses. Operating cash flow (CFO) is "net cash from operating activities" in the cash flow statement.
- Cash conversion, this year: CFO ÷ net profit. 0.8 or more passes; anything lower is "worth watching" but never a red flag, because one year's working-capital swing is common.
- Cash conversion, three years: three years' CFO ÷ three years' profit. 0.8 or more passes; below 0.5, or negative total CFO, is a red flag.
- Accruals (Sloan): (net profit − CFO) ÷ average total assets. Up to 5% passes; over 10% is a red flag. A negative number means cash flow beat profit, the good direction.
- Receivables vs sales: receivable days (receivables ÷ sales × 365) against last year. Up 5 days or less passes; a red flag needs both a rise of more than 15 days and receivables growing more than 20 percentage points faster than sales.
- Inventory vs sales: the same rule with inventory days.
- Other income share of PBT: other (non-operating) income ÷ profit before tax. Up to 15% passes; over 35% is a red flag.
- Exceptional items: exceptional or extraordinary items ÷ reported net profit, either sign. Up to 10% passes; over 25% is a red flag.
A check the statements cannot answer is left out, not failed: a loss year (a cash ratio over a negative profit means nothing), a missing line, or a company without three years of accounts.
The grade
- A: no red flag, and every tested check but one passed, with at least five tested.
- B: no red flag.
- C: one red flag.
- D: two or more red flags.
Beneish's M-score, a well-known manipulation screen, is deliberately not used: it needs SG&A and net fixed assets, which the FY26 statements in the data do not carry.
Worked examples: FY26 accounts, 6 November 2026
On 6 November 2026 the page graded 2,056 companies on (mostly) FY26 accounts: 564 A, 328 B, 553 C and 611 D. It left out 265 banks, NBFCs and insurers, and 16 companies without enough usable statements to run three checks. 425 companies were tagged Improving.
BEL: grade D, three red flags
- Cash conversion this year 0.26 (worth watching): operating cash flow was about a quarter of profit.
- Three-year cash conversion 0.44: red flag (below 0.5).
- Accruals 10.53% of average assets: red flag (over 10%).
- Receivable days up 30.2 on the year, with receivables outgrowing sales by more than 20 points: red flag.
- Inventory days fell 5.5 (pass), other income was 7.03% of PBT (pass), exceptional items 0.46% (pass).
The three flags tell one story: profit was booked, but the cash had not yet been collected. For a defence supplier whose main customer is the government, slow payment can have a plain business reason. The grade cannot tell you whether it does; the panel's year-by-year table and the annual report can. The year before, BEL had one flag (grade C).
Asian Paints: grade A, seven passes
Cash conversion 1.60 this year and 1.27 over three years; accruals −8.16% (cash flow ran well ahead of profit); receivable days −0.7 and inventory days −13.4; other income 12.13% of PBT; exceptional items 2.71%. Infosys, DMart, Britannia, Trent and UltraTech also passed all seven.
Rows that need the panel
- JSW Steel: D. Its cash checks were strong (2.74 this year, 2.70 over three), but other income was 63.21% of profit before tax and exceptional items 58.81% of reported profit: two flags. The same company scored 9 out of 9 on Piotroski in the Quality Scores page. The two pages ask different questions: Piotroski asks whether the business improved; this asks how much of the profit came from the operating business this year.
- Bajaj Auto: D. Three-year cash conversion 0.30, accruals 12.49%, inventory days up 21.7. Its consolidated accounts now include a captive financing arm, and loans it makes count as operating cash outflow, which can drag these ratios for reasons that have nothing to do with selling motorcycles.
- Bharti Airtel: A, up from D (two flags) the year before, so it carries the Improving tag. Cash conversion was 4.59 this year: a telecom operator's large depreciation means cash flow far exceeds profit.
How to use it in a trade
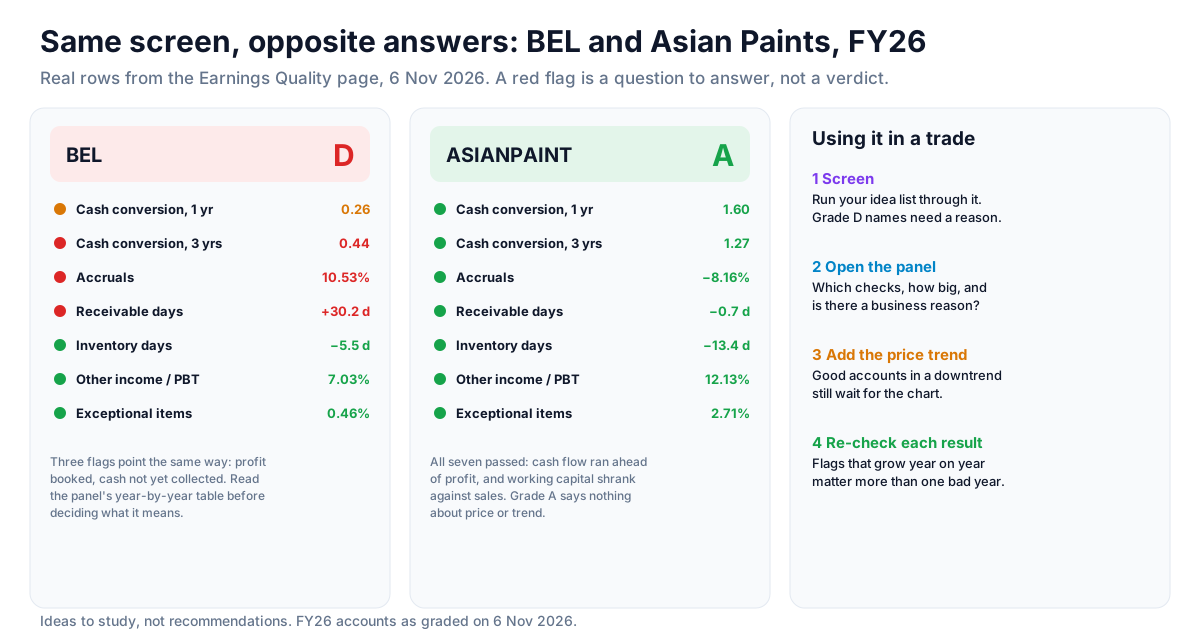
The grade is a filter on which companies deserve a closer look, and a risk note on the ones you already hold or watch. It is not an entry or an exit.
- Screen your idea list. Before acting on a breakout or a momentum scan, look the name up here. A D grade is a reason to read more, not an automatic reject.
- Open the panel. Which checks are flagged, by how much, and is there a business reason (a contractor's advances, a lending subsidiary, a one-off asset sale)? The year-by-year table shows whether the problem is new or old.
- Weigh the pattern, not the count. Cash conversion, accruals and receivables flagged together point at one thing: profit not turning into cash. A lone other-income flag in a cash-rich company is a much smaller worry.
- Add the price trend. Good accounts in a falling stock still wait for the chart; weak accounts in a rising stock deserve a tighter stop and a smaller size.
- Re-check after each annual result. A flag that appears two years running matters more than one bad year.
Strategy ideas (ideas, not promises)
These are ideas to study, paper-trade and backtest, not recommendations or signals, and not a promise of any result. Accounting checks describe last year's accounts, and a red flag can have an innocent explanation. Size, entries, exits and risk are your own decisions.
1. Quality filter on a momentum list
- Setup: take the names from Momentum Rank, Trend Template or the 52 Week High page, and keep only grades A and B.
- Reading: a strong price backed by cash-backed profit is the combination many growth investors look for.
- Invalidation: the chart setup failing (the stop), or a new D grade at the next annual result.
2. The cash-flow improvers (Improving tab)
- Setup: two fewer flags than the year before, or two more checks passed with no new flag.
- Reading: a company whose cash is catching up with its profit, as with Bharti Airtel's move from D to A.
- Entry idea: only with a price confirmation such as a reclaimed 200-day average.
3. A risk list for what you hold
- Setup: any holding that moves to C or D, especially with cash conversion and receivables flagged together.
- Reading: not a sell signal by itself, but a reason to read the annual report's notes on receivables and to tighten risk.
4. Short-side research
- Setup: grade D with three-year cash conversion and accruals both flagged, a weak Piotroski score, and the price below a falling 200-day average.
- Reading: the mirror of idea 1. Positional shorts need F&O stocks, and good news can squeeze a short hard.
- Invalidation: a close back above the 200-day average.
How to test these
Download each tab as a CSV and keep it dated. Record what the A and D names did over the following year, and whether flagged companies' next results confirmed the problem. Build the price rules (trend filter, entry, stop) on Unfluke's backtester and run them only on the names your quality filter kept.
Every tab, filter, column and panel
The tabs
- All: every graded company, best grade first.
- High quality: grade A.
- Red flags: two or more flags (grade D), most flags first.
- Improving: two fewer flags than the year before, or two more checks passed with no new flag.
The filter
Universe: All, Nifty 50, Nifty Next 50, Nifty Bank, F&O or Nifty 500.
The columns
- Symbol and LTP: the close and change in the newest session.
- Sector.
- Grade (A to D) with seven dots under it, one per check: green passed, amber worth watching, red flagged, grey not enough data. Hover a dot for its name.
- Flags: the number flagged, with last year's count.
- CFO / Profit 3Y: three-year cash conversion.
- Accruals: as a % of average total assets.
- Δ Receivable Days: the change on the year before.
- Other Inc. / PBT: other income as a % of profit before tax.
- Year: the fiscal year checked, and consolidated or standalone.
Click a header to sort; the download button saves the current tab as a CSV.
The row panel
Click a row to open it. The seven checks lists each test with its status and the figures behind it. Year by year shows up to six fiscal years of net sales, net profit, operating cash flow, cash flow ÷ profit, accruals, receivable and inventory days, other income as a % of PBT, and exceptional items, so you can see whether a flag is new or a habit.
What the numbers are built from
Capitaline's annual statements (balance sheet, profit and loss, cash flow), joined to NSE symbols; consolidated accounts unless the standalone ones are more recent or the only ones, twelve-month years only. Prices from the newest NSE Bhavcopy. The list is rebuilt every few hours, but the accounts change only when companies publish annual results.
- Days on sales. Receivable and inventory days are both measured against net sales, because cost of goods is not reported on the same basis across the FY26 source change. Inventory days therefore compare like with like across years but are not textbook inventory days.
- Consolidated accounts include every subsidiary. A lending arm, an insurance arm or a project business inside a group changes cash flow in ways the checks read literally.
- Total assets for the accruals check use the Schedule III total only; where it is missing, the check is left out.
- Banks, NBFCs and insurers are not graded. Their cash flow is mostly lending and deposits, so these checks do not describe them.
None of the checks proves good or bad accounting. They show where profit and cash disagree, which is where to start reading.
Where to go next
Pair this with Quality Scores (did the business improve?) and the DCF Valuation guide (what is the cash worth?). For context against rivals, read the Peer Comparison guide; for how prices react to the numbers, the Results Reaction guide. Open the page at Fundamental → Earnings Quality, or sign up free to open any company's panel.
More from the blog
- Strategy Backtesting on Unfluke
Backtest trading strategies on real Indian market data with Unfluke. Test equity, Nifty, Bank Nifty and options strategies with realistic costs and key metrics.
- Live Market Scanners
Explore Unfluke's real-time stock scanner for NSE markets. Scan 1,800+ stocks with 40+ technical indicators, fundamental filters, F&O data and custom rules.
- Option Strategy Simulator
Build and simulate multi-leg options strategies with Unfluke. Visualize payoffs, Greeks, max profit and loss, and replay historical option data from 2023.