Market Terminal
DCF Valuation: Intrinsic Value, Reverse DCF and the Sensitivity Grid for NSE Stocks
12 min read · Updated 9 Nov 2026
A share is a claim on the cash a business will produce for as long as it exists. A discounted cash flow (DCF) model tries to put a number on that: project the cash, then shrink each future year's cash back to what it is worth today. The answer depends heavily on a few guesses about growth and interest rates, which is why a DCF is most useful when you treat it as a question rather than a price target.
The DCF Valuation page in the Market Terminal builds the model for any listed non-financial company from its own cash flow statements, lets you change every assumption, and runs it backwards too: the reverse DCF tells you what growth today's price already assumes. This guide explains the method, walks through the real Reliance Industries page of 6 November 2026 line by line, and shows how to use the answer in a trade.
What a DCF is, and the version the page runs
Free cash flow
The model starts from free cash flow (FCF): the cash the business generated from operations, less what it spent on new plant, buildings and equipment (capex). It is the cash left over for the people who financed the company, lenders and shareholders together. The page takes both lines from the annual cash flow statement ("net cash from operating activities" and "fixed assets purchased"). When a year's statement has no capex line, it estimates capex as the change in net block and capital work in progress plus depreciation, and marks that year with an asterisk.
The two stages
The page projects ten years of FCF and then a value for everything after:
- Base FCF: the average FCF of the last three years (one lumpy year does not set the whole valuation), or the latest year alone when fewer than two of the three are known.
- Years 1 to 5 grow at the company's five-year sales CAGR (three years if five are not on file), held between 0% and 20% and rounded to the nearest 0.5%. With no sales history it uses 8%.
- Years 6 to 10 grow at a rate halfway between that and the terminal rate, so growth slows down rather than stopping dead.
- After year 10, a terminal value assumes FCF grows at a steady rate for ever (the Gordon growth formula): year-10 FCF × (1 + terminal growth) ÷ (discount rate − terminal growth). The default terminal growth is 5%.
- Every future year's cash is discounted at 12% a year by default: ₹100 due in ten years is worth ₹100 ÷ 1.1210, about ₹32, today.
From business value to a share price
The sum of the discounted cash flows is the enterprise value, the value of the whole business. Lenders get paid first, so the page subtracts net debt (borrowings including lease liabilities, less cash and current investments, from the latest balance sheet). With consolidated accounts it also subtracts minority interest, the share of subsidiaries owned by outsiders. What remains is the equity value; divided by the number of shares, it is the DCF value per share.
The reverse DCF
The reverse DCF turns the question round. Holding the base FCF, discount rate, terminal growth and balance sheet fixed, it finds the single growth rate, held for all ten years, at which the model's value equals today's share price. It needs no forecast from you, only the price, so it is often the more honest of the two numbers: "the market is paying for X% growth a year" is something you can check against the company's history.
Who is not valued
Banks, NBFCs and insurers get an explanation instead of a value. A lender's operating cash flow is mostly its loan book moving, so its "free cash flow" swings with lending rather than with what the business earns. Lenders are better compared on book value and return on equity, and the page offers a button to open them in Peer Comparison.
A worked example: Reliance Industries, 6 November 2026
Reliance is the page's default company. On 6 November 2026 it closed at ₹1,320 (+0.5%). The page used its consolidated FY26 accounts and counted 1,353.2 crore shares (share capital ÷ the ₹10 face value), a market cap of ₹17,86,224 crore. All figures below are in ₹ crore, exactly as the page showed them.
The cash flow history
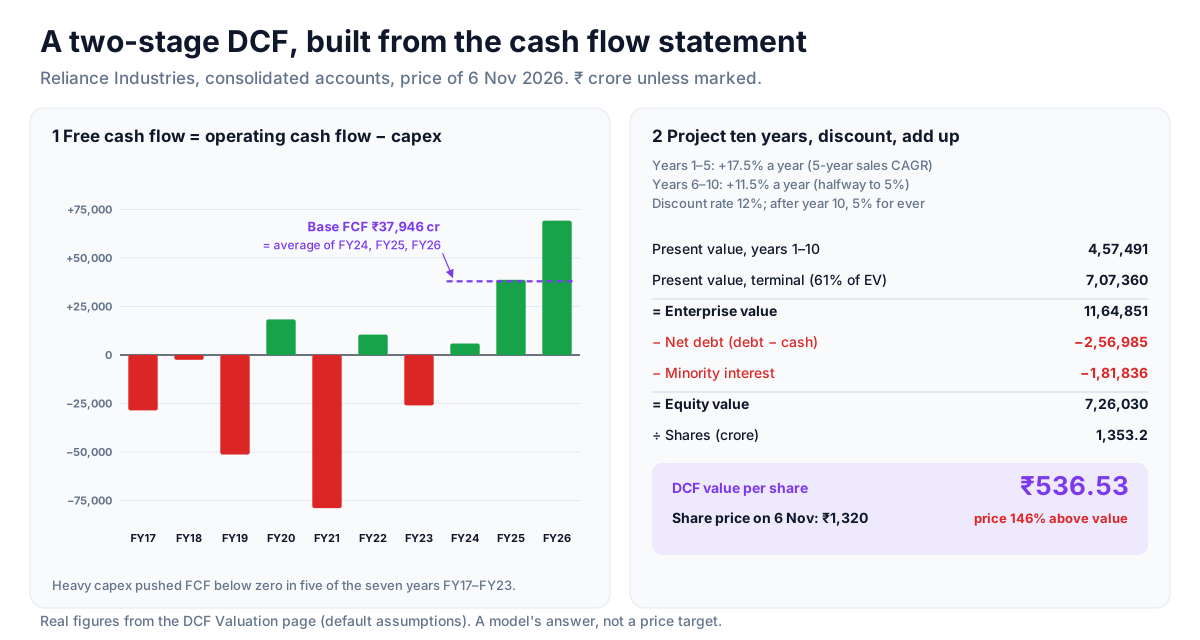
- FY17 to FY23: operating cash flow was large, but capex (refining, Jio's network, retail stores, new energy) was larger in five of those seven years. FCF ranged from −78,879 (FY21) to +18,360 (FY20).
- FY24 to FY26: capex eased and FCF turned positive: 5,905, 38,736 and 69,197. In FY26 operating cash flow was 1,92,113 against capex of 1,22,916, and FCF was 88.9% of net profit.
- Base FCF: 37,946, the average of those last three years. The page warned that FCF was negative in one of the last five years (FY23), so the base is an average of uneven years.
The default assumptions and the value
- Growth years 1 to 5: 17.5%, from a five-year sales CAGR of 17.7% (₹4,66,924 crore in FY21 to ₹10,55,780 crore in FY26). Years 6 to 10: 11.5%.
- Discount rate 12%, terminal growth 5%.
- Present value of years 1 to 10: 4,57,491. Present value of the terminal value: 7,07,360, which is 61% of the total.
- Enterprise value 11,64,851, less net debt of 2,56,985 (borrowings 4,02,962 less cash 1,45,977) and minority interest of 1,81,836, leaves equity of 7,26,030.
- DCF value: ₹536.53 a share, against a price of ₹1,320. The "margin of safety" card read −146.0%, price above value.
What that does and does not mean
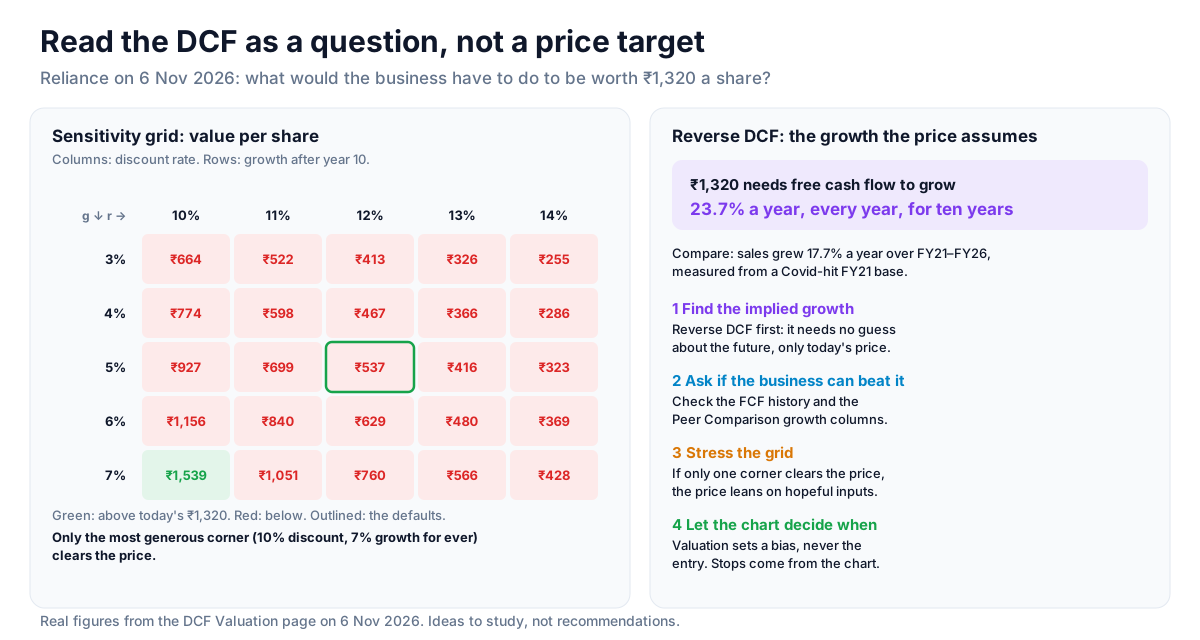
It does not mean Reliance is worth ₹537. The reverse DCF card is the better reading: at ₹1,320 the market was pricing in FCF growth of 23.7% a year for ten years. Two things in the history make that less strange than it sounds. First, the base averages a weak FY24 with a much stronger FY26. Change only the base FCF to FY26's 69,197 and the value becomes about ₹1,245, close to the price. Second, the 17.7% sales CAGR starts from FY21, a year hit by the Covid lockdown and low oil prices, so it flatters the trend.
The sensitivity grid makes the point visually. Of its 25 cells (discount rate 10% to 14%, terminal growth 3% to 7%), only one, 10% and 7%, gave a value above ₹1,320 (₹1,539). In plain words: the price assumes either that the recent drop in capex lasts, or that the cash flow keeps compounding fast for a decade. That is a view you can test against the company's plans, which is exactly what the page is for.
How to use it in a trade
A DCF changes when the annual accounts change, once a year. The price changes every minute. So the page is a filter for which stocks deserve attention and a check on how much optimism a price holds, never a timing tool on its own.
- Start with the reverse DCF. Write down the implied growth. Then look at the free cash flow history table: has this company ever grown FCF that fast for that long?
- Compare it with peers. Open the company in Peer Comparison (sales growth, three-year CAGR, margins). A price that needs 25% growth from a business growing 5% a year needs a reason you can name.
- Stress the inputs. Change one thing at a time in the Assumptions panel (the base FCF, the discount rate) and watch the value. If the answer only works in one corner of the sensitivity grid, the price is leaning on hopeful inputs.
- Let the chart pick the moment. A stock that looks cheap on cash flow can stay cheap for years. Wait for the price to confirm (above a rising 200-day average, a breakout from a base), and place the stop where the chart says, not where the DCF says.
- Redo it when the next annual results land. The base FCF, growth default and net debt all move with the new year's accounts.
Strategy ideas (ideas, not promises)
These are ideas to study, paper-trade and backtest, not recommendations or signals, and not a promise of any result. A DCF is a model of guesses, and the market can disagree with it for years. Size, entries, exits and risk are your own decisions.
1. Low implied growth plus an uptrend
- Setup: the reverse DCF implies growth below the company's own five-year sales CAGR, and FCF has been positive in most of the last five years.
- Reading: the price asks less of the business than it has already delivered.
- Entry idea: only once the price is above a rising 200-day average or breaks out of a base on volume.
- Invalidation: a close below the base, or new annual accounts that cut FCF sharply.
2. Priced for perfection: a list to avoid or to short
- Setup: implied growth far above any growth the company has shown, and the value below the price in every cell of the grid.
- Reading: any disappointment has a long way to fall. This is a reason not to chase a breakout, not a short signal by itself; strong stories can stay expensive.
- Check: short positions held overnight need F&O stocks, and the price trend should already be falling.
3. Capex cycle turning
- Setup: a history like Reliance's, years of heavy capex then FCF turning positive and rising.
- Reading: the three-year average base lags the latest year. Rerun the model with the latest FCF as the base and see how far the value moves.
- Invalidation: the company announces a new round of heavy spending (capex is in the annual report and results commentary).
4. A margin-of-safety watchlist
- Setup: keep a dated list of companies whose DCF value per share is above the price with the default inputs and still above it one step worse on both discount rate and terminal growth.
- Reading: the value survives a less generous set of inputs.
- Entry idea: act only on a chart trigger; review the list after each annual result.
How to test these
The page values one company at a time on its latest accounts, so keep your own dated notes: the price, value, implied growth and grid for each name you study. Then record what the stock did over the following months. The price-side rules (the 200-day filter, the breakout, the stop) can be built and backtested on Unfluke's backtester for the names your valuation work picked.
Every card, input and table on the page
Picking a company
The Company box searches every listed company with statements on file and a price in the newest session. Reliance opens by default; signing in lets you pick any other.
The four cards
- DCF value / share, with the equity value under it.
- Margin of safety: (value − price) ÷ value. Positive means the value is above the price; negative means the price is above the value.
- Implied growth (reverse DCF): the yearly FCF growth for ten years that today's price needs. "Over 100%" or "below −50%" means the answer is outside the range searched.
- Market cap, with the share count used.
Assumptions
Seven inputs, all editable, and everything recalculates in the browser as you type: base FCF (₹ crore), growth years 1 to 5, growth years 6 to 10, discount rate, terminal growth, net debt and minority interest. Reset returns to the starting values. The notes under the inputs say how each default was chosen. The discount rate must stay above terminal growth, or the terminal value has no finite answer and the page says so.
The panels
- How the value adds up: present value of years 1 to 10, of the terminal value, enterprise value, less net debt and minority interest, equity value, shares and value per share, with the terminal value's share of the total.
- Reverse DCF: the implied growth in a sentence, next to your own years 1 to 5 assumption.
- Sensitivity: value per share for discount rates one and two points either side of yours (columns) and terminal growth likewise (rows). Green cells are above today's price, red below; the centre cell is your inputs.
- Projected free cash flow: each of the ten years and the terminal value, with present values.
- Free cash flow history: a chart and a table of up to ten years: operating cash flow, capex, FCF, net profit, FCF as a share of profit, and sales. An asterisk marks an estimated capex.
Warnings
Read them before the number. The page warns when:
- FCF was negative in some of the last five years, so the base is an average of uneven years;
- the base FCF is negative or missing, in which case no value is shown until you enter a base you believe the business can reach;
- more than 75% of the value sits in the terminal value, beyond year ten;
- net debt and minority interest exceed the value of the cash flows (common for heavily indebted or regulated businesses);
- shares × EPS does not come back to roughly the year's profit, a sign the share count may be off;
- the newest annual accounts are more than a year old.
What the numbers are built from
Statements are Capitaline's annual accounts (₹ crore), the same ones the stock pages and Quality Scores use, joined to NSE symbols. The page uses consolidated accounts unless the standalone ones are more recent or the only ones filed, and twelve-month years only. Prices are the newest NSE Bhavcopy close.
- Share count: nothing in the statements carries one, so it is share capital ÷ face value (from NSE corporate actions on the price date), multiplied up for any bonus issue since the balance sheet date. A stock with no corporate action on record falls back to the last annual market cap ÷ that year's closing price.
- Net debt includes lease liabilities when the balance sheet reports total debt that way, and counts current investments as cash.
- Capex is purchase of fixed assets; acquisitions of other companies are not included, so an acquisitive company's FCF can look better than its cash spending.
- One discount rate for every company. 12% and 5% are reasonable starting points for an Indian company, not estimates of this company's cost of capital. Riskier businesses deserve a higher rate.
A DCF is only as good as its inputs. The page is built to show how much the answer moves when the inputs do, not to hand you a target price.
Where to go next
Put the company next to its rivals with the Peer Comparison guide, check that profits turn into cash with the Earnings Quality guide, and test the balance sheet with Quality Scores. For the basics, read fundamental analysis and P/E and EPS explained. Open the page at Fundamental → DCF Valuation, or sign up free to value any company.
More from the blog
- Strategy Backtesting on Unfluke
Backtest trading strategies on real Indian market data with Unfluke. Test equity, Nifty, Bank Nifty and options strategies with realistic costs and key metrics.
- Live Market Scanners
Explore Unfluke's real-time stock scanner for NSE markets. Scan 1,800+ stocks with 40+ technical indicators, fundamental filters, F&O data and custom rules.
- Option Strategy Simulator
Build and simulate multi-leg options strategies with Unfluke. Visualize payoffs, Greeks, max profit and loss, and replay historical option data from 2023.