Market Terminal
Peer Comparison: How a Stock Ranks Against Its Industry on Valuation, Returns and Growth
10 min read · Updated 9 Nov 2026
A P/E of 17 means little on its own. For a cement company it might be expensive; for a software company with a 50% return on equity it might be cheap. Valuation and quality only make sense against the companies a business actually competes with, which is why analysts start almost every report with a peer table.
The Peer Comparison page builds that table for any listed Indian company: twelve measures for every company in its industry, the group median, and where the company ranks on each. This guide explains each measure, reads the real TCS page of 6 November 2026 against 47 other software companies, and shows how to turn a peer table into a trade idea rather than a verdict.
What the page compares, and how ranks work
The peer group
Every listed company carries three levels of classification in the company profiles: an industry (narrowest), a broad industry, and a sector (widest). The page starts with the industry. If the industry has fewer than four listed companies with accounts and a price, it widens to the broad industry, then to the sector, and says so. You can switch levels yourself; the box shows each group's name and size.
The twelve measures
- Market cap: shares × latest close (₹ crore).
- P/E: market cap ÷ the latest annual net profit (before extraordinary items). Blank for a loss.
- P/B: market cap ÷ shareholders' funds (book value).
- ROE: net profit ÷ the average of this year's and last year's equity.
- ROCE: EBIT (profit before tax plus interest) ÷ average capital employed (equity plus debt).
- EBITDA margin: (net sales − total expenditure) ÷ net sales. Other income is left out, so it measures the operating business.
- Sales growth and profit growth: the latest year against the one before.
- Sales CAGR 3Y: compound yearly sales growth over three years.
- Debt / equity: total debt (including leases where reported) ÷ equity.
- Dividend yield: dividends with an ex-date in the last twelve months, restated for later splits and bonuses, ÷ the close.
- 1Y return: the price change from the session a year earlier, adjusted for splits and bonuses.
Banks, NBFCs and insurers stay in the table, but are not ranked on ROCE, EBITDA margin or debt / equity: capital employed, margins and leverage do not describe a lender.
Rank, percentile and median
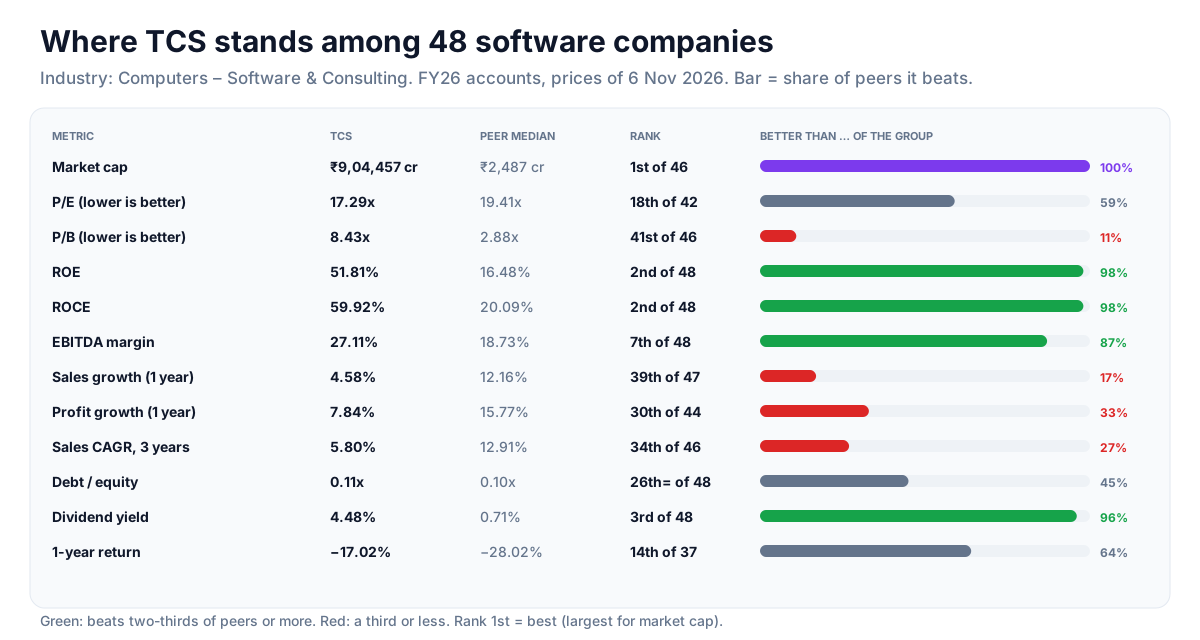
For each measure the page knows which way is better: higher for returns, margins, growth, yield and return; lower for P/E, P/B and debt / equity; and simply larger for market cap. Rank 1st is the best in the group. The bar under each card shows the share of the other companies it beats (a tie counts as half), so 50% is the middle. Companies with no value for a measure (a loss-maker's P/E) are left out of that rank, which is why TCS is "18th of 42" on P/E but "2nd of 48" on ROE. The median is the middle value of the group, which a few extreme companies cannot drag the way an average can.
A worked example: TCS among software peers, 6 November 2026
TCS is the page's default company. Its industry, Computers - Software & Consulting, held 48 companies with accounts and a price (the broad industry, IT - Software, held 64; the sector, Information Technology, 126). Accounts were mostly FY26, prices from 6 November 2026 and the 1-year return from 6 November 2025.
Where TCS leads
- Market cap ₹9,04,457 crore, the largest of the group (median ₹2,487 crore).
- ROE 51.81% and ROCE 59.92%, both 2nd of 48 (medians 16.48% and 20.09%). Only KSOLVES, a company of about ₹506 crore, was higher on both.
- EBITDA margin 27.11%, 7th of 48 (median 18.73%).
- Dividend yield 4.48%, 3rd of 48 (median 0.71%).
Where it lags
- Sales growth 4.58%, 39th of 47 (median 12.16%); three-year sales CAGR 5.80%, 34th of 46.
- Profit growth 7.84%, 30th of 44 (median 15.77%).
- P/B 8.43x, 41st of 46 (median 2.88x). A high P/B is what a very high ROE looks like: the business earns a lot on a small book.
In the middle
- P/E 17.29x, 18th of 42, a little below the median of 19.41x.
- Debt / equity 0.11x, 26th of 48 with two others level (median 0.10x): almost no debt, like most of the group.
- 1-year return −17.02%, 14th of 37. The median was −28.02%: the whole industry had a bad year, and TCS fell less than most.
Reading it together
The table describes a very profitable, slow-growing leader priced near the group's median P/E. The fast growers sit elsewhere: Persistent (sales +23.5%, P/E 49.61) and Coforge (sales +36.1%, P/E 40.81) carry P/Es well above the median, and the market is paying for that growth. Neither group is "right"; they are different bets. The peer table's job is to make that trade-off visible before you look at a chart.
How to use it in a trade
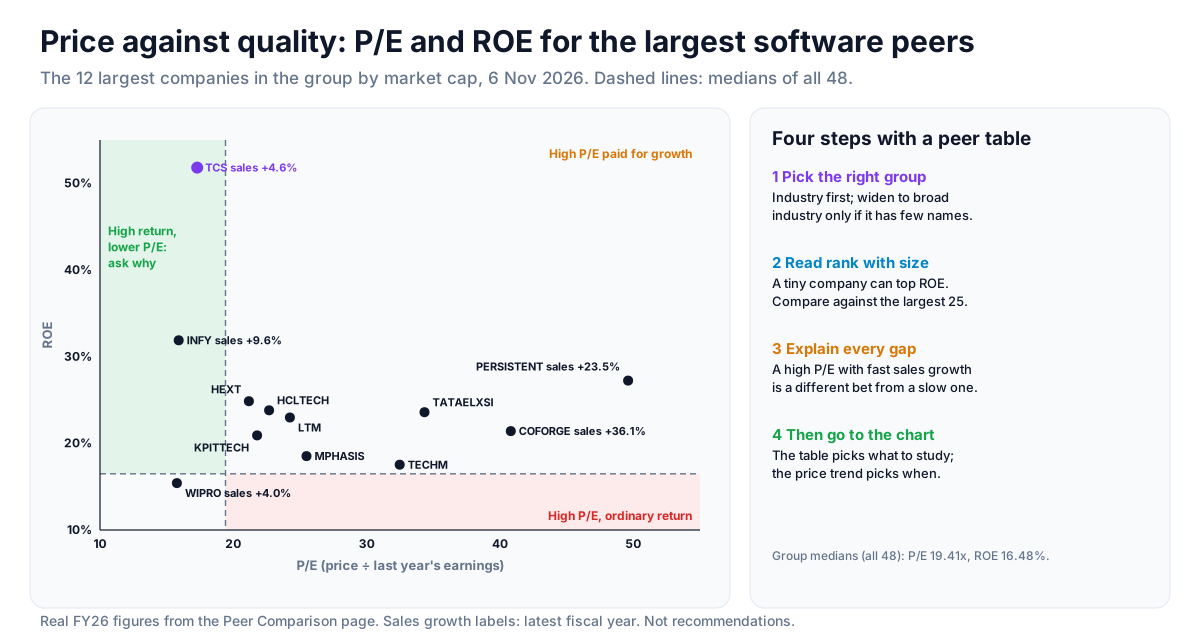
- Pick the right group. Start with the industry. If it is tiny or mixes very different businesses, widen to the broad industry. A conglomerate will sit in one industry only, so treat its ranks loosely.
- Read ranks with size. Small companies often top the return and growth columns: a ₹500 crore firm can show a 135% ROE on a tiny equity base. The table lists peers largest first; compare against the companies of similar size.
- Explain every gap. A P/E far below the median needs a reason (slow growth, high debt, a one-off profit). A P/E far above needs one too (faster growth, better margins). If you cannot name it, you have found what to research.
- Cross-check the cash. Before trusting a cheap P/E, look the company up on Earnings Quality: profit that does not turn into cash makes every ratio built on it look better than it is.
- Then go to the chart. A peer table changes once a year. Entries, stops and exits come from the price.
Strategy ideas (ideas, not promises)
These are ideas to study, paper-trade and backtest, not recommendations or signals, and not a promise of any result. Ratios describe last year's accounts, which the price may already reflect. Size, entries, exits and risk are your own decisions.
1. Quality at a fair price
- Setup: ROE and ROCE in the top third of the group, P/E at or below the median, debt / equity below the median.
- Reading: a business that earns more on its capital than its rivals, priced no higher than them. Ask why: slower growth, as with TCS, is a common answer.
- Entry idea: on a chart trigger, such as a pullback that holds a rising 50-day average.
- Invalidation: a close below the pullback low; or next year's accounts show the return slipping toward the median.
2. Growth leader with momentum
- Setup: top-third sales growth and three-year CAGR, margins at or above the median, and a 1Y return in the top third.
- Reading: the market is already paying for the growth; the trade is that it continues. These names often carry the highest P/Es.
- Invalidation: a growth slowdown in the quarterly results, or the price losing its 50-day average on heavy volume.
3. Laggard catch-up (relative value)
- Setup: two companies in the same industry with similar ROE, margins and growth, but very different P/Es.
- Reading: if nothing in the table explains the gap, it may close. Check that the cheaper one is not cheap for a reason the table cannot show (governance, a pending case, a customer loss).
- Check: a pair trade (long the cheap one, short the dear one) needs both to be F&O stocks; see the Correlation & Pairs guide for measuring the spread.
4. Yield with cover
- Setup: dividend yield in the top third, debt / equity below the median and ROE above it.
- Reading: a high yield from a well-financed, profitable company is more likely to last. Confirm the payout on the Dividend Tracker.
How to test these
Download the peer table (CSV) for the industries you follow and keep it dated, then note how the names you picked behaved over the next months and through the next annual results. The entry and exit rules can be backtested on Unfluke's backtester for the names the table selected.
Every control, card and column
The controls
- Company: search any listed company with accounts and a price in the newest session. TCS opens by default; signing in lets you pick any other.
- Peer group: Industry, Broad industry or Sector, each shown with its name and the number of companies in it.
The summary line
It names the group and its size, says when the page widened the group because the industry had fewer than four companies, gives the fiscal year most of the group reports and the price dates, and flags a lender. If the company's share count fails the page's sanity check (shares × EPS far from the year's profit), a red note says market cap, P/E and P/B may be wrong.
The standing cards
One card per measure: the company's value, the group median, its rank ("2nd of 48", with "=" when others share the value) and a bar for the share of the group it beats. The bar is green at 67% or more, red at 33% or less, grey between, and purple for market cap, where bigger is not "better".
The peer table
Every company in the group with all twelve measures, largest first. It shows the largest 25 plus the chosen company until you click Show all. Click any column header to sort by it, any row to make that company the subject, and the download button to save the table as a CSV. A note under the table repeats how each measure is defined.
What the numbers are built from
Statements are Capitaline's annual accounts, the same ones the stock pages use: consolidated unless the standalone accounts are more recent or the only ones, twelve-month years only. Prices are the newest NSE Bhavcopy close, and the 1-year return uses the session about 365 days earlier. Dividends come from NSE's corporate actions. The whole table is rebuilt every few hours.
- Different fiscal years. Most companies report to March; a few use December or June (marked, e.g. "FY25 (Dec)"). The page compares each company's latest full year, so a December-year company can be nine months behind its peers.
- Share count is derived (share capital ÷ face value, adjusted for later bonuses), so market cap, P/E and P/B carry the same caveat as on the DCF page; the sanity check flags the obvious misses.
- Annual figures only. P/E uses the last annual profit, not the trailing four quarters, so it can lag a fast-changing business by up to a year.
- Classification comes from the company profiles. A company that has changed its business may sit in its old industry.
Where to go next
Value a company on its own cash flows with the DCF Valuation guide, check its profit quality with the Earnings Quality guide, and its dividend record with the Dividend Tracker guide. For the price side, read the Relative Strength Rating and Trend Template guides. Open the page at Fundamental → Peer Comparison, or sign up free to compare any company.
More from the blog
- Strategy Backtesting on Unfluke
Backtest trading strategies on real Indian market data with Unfluke. Test equity, Nifty, Bank Nifty and options strategies with realistic costs and key metrics.
- Live Market Scanners
Explore Unfluke's real-time stock scanner for NSE markets. Scan 1,800+ stocks with 40+ technical indicators, fundamental filters, F&O data and custom rules.
- Option Strategy Simulator
Build and simulate multi-leg options strategies with Unfluke. Visualize payoffs, Greeks, max profit and loss, and replay historical option data from 2023.