Market Terminal
Top Gainers, Losers and Gap Up / Gap Down Stocks: How to Read Them
10 min read · Updated 2 Nov 2026
The Movers page shows NSE's top gainers, top losers, volume gainers, gap up, gap down and most active stocks in one place, each with a ranked chart and a sortable table.
This guide explains what each tab means, how to read every column, and how analysts commonly interpret movers data - especially opening gaps - along with the limits of what it shows.
What are top gainers, top losers and gap stocks?
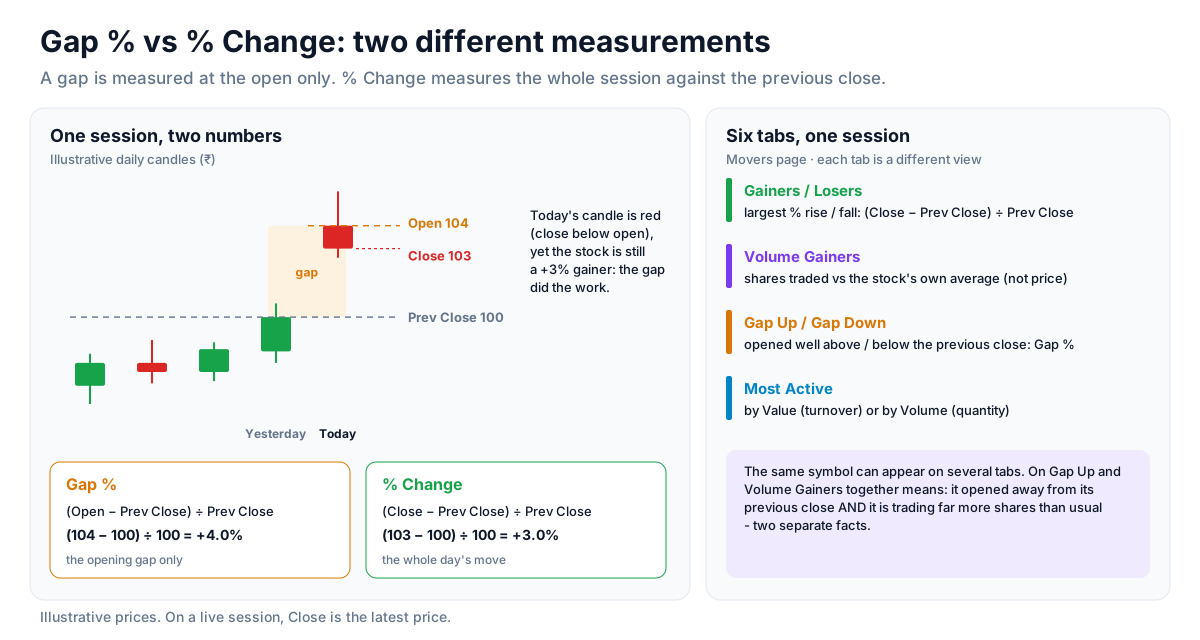
Top gainers are the stocks with the largest percentage rise in price for a session, and top losers are the stocks with the largest percentage fall. Volume gainers are stocks trading far more shares than usual. A gap up or gap down stock is one that opened well above or below the previous day's close.
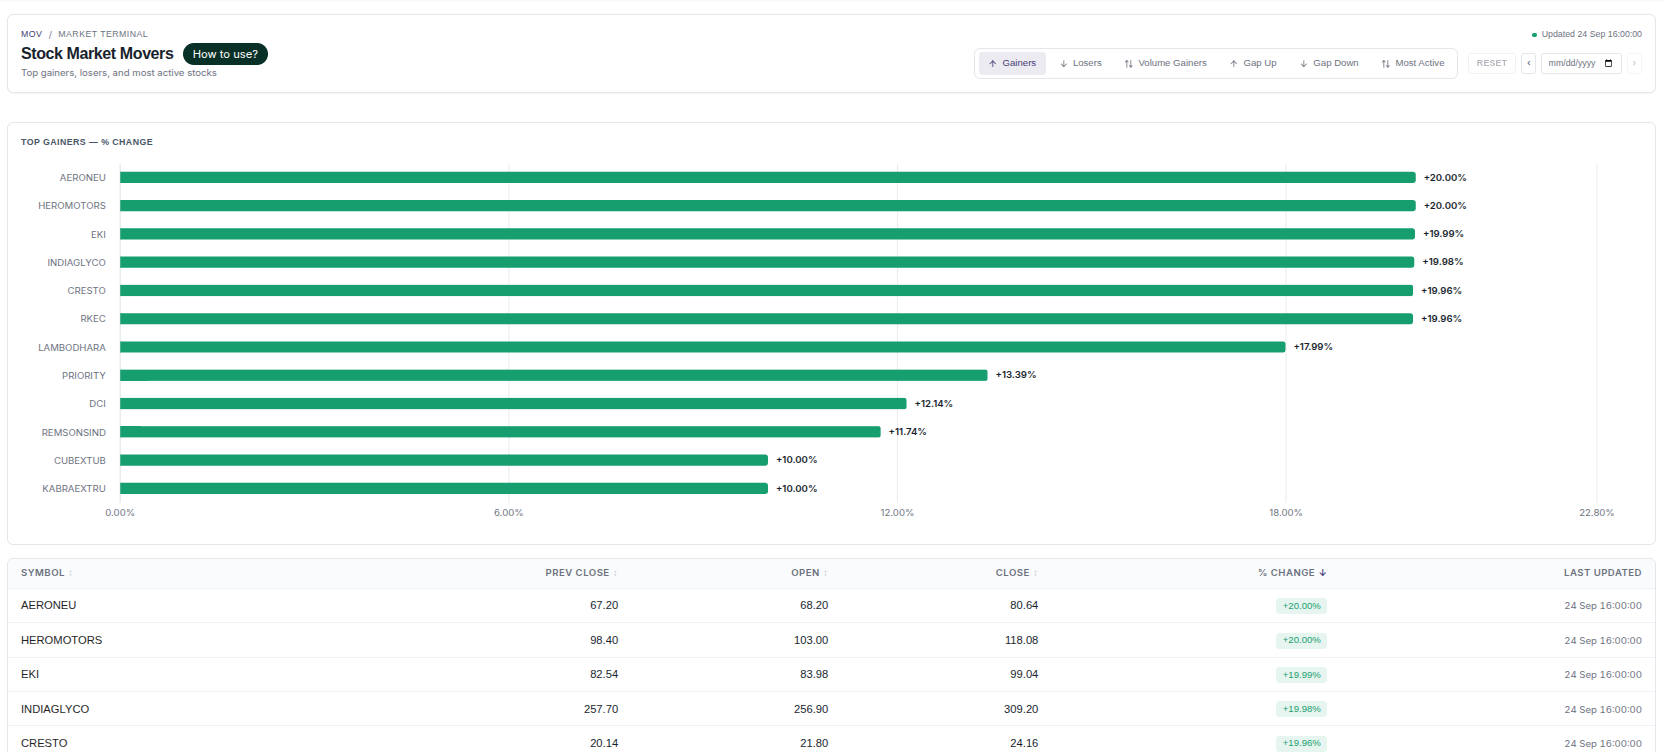
The Movers page has six tabs: Gainers, Losers, Volume Gainers, Gap Up, Gap Down and Most Active. Without a date selected it shows the current session; the date picker in the header loads a past session instead.
How to read it
- Ranked chart - the top 12 rows of the active tab, plotted by % change (green up, red down).
- Gainers / Losers columns - Symbol, Prev Close, Open, Close and % Change, where % Change is (Close − Prev Close) ÷ Prev Close. On a live session, Close is the latest price.
- Volume Gainers columns - Volume (shares traded), Avg Volume (a one-week average live, a 20-session average on a past date), % Change (volume versus that average, not price) and Turnover in ₹ lakh.
- Gap Up / Gap Down columns - Prev Close, Open and Gap %, calculated as (Open − Prev Close) ÷ Prev Close. It is the opening gap only, not the whole day's move.
- Most Active columns - Prev Close, Open, Close, % Change, Qty Traded and Turnover (₹L). The By Value / By Volume switch sits on the chart panel.
- Last Updated - when NSE last refreshed that list. Every column header except Last Updated can be sorted.
How the tabs relate to each other
The six tabs are different views of the same session, so the same symbol can appear on more than one. A stock that shows up on Gap Up and Volume Gainers, for example, opened away from its previous close and is also trading far more shares than usual - two separate facts about the session that are easier to understand together. From there, the symbol can be checked against its sector on the Nifty 50 heatmap, the broader market on the Indices page, and any news or corporate action behind the move on Market Info.
Concept 1: a gap that holds
One way market studies describe gaps is by what happens after the open: does the price stay above (or below) its opening level through the first 15-30 minutes? A gap that holds while the same symbol also appears on Volume Gainers is described as having broad participation behind it. If the price later trades back through the open, that description no longer applies - the data describes the session so far, not what comes next.
Concept 2: the gap fill
A gap fill is when the price drifts back toward the previous close after the open. In market studies it is discussed most often for thinly traded or news-sensitive stocks, especially ones with no matching appearance on Volume Gainers. A gap-up stock that opened near its upper circuit and then traded away from it (visible on Price Band Hitters) is what analysts call early exhaustion - a description of the session, not a forecast.
Strategy ideas (ideas, not promises)
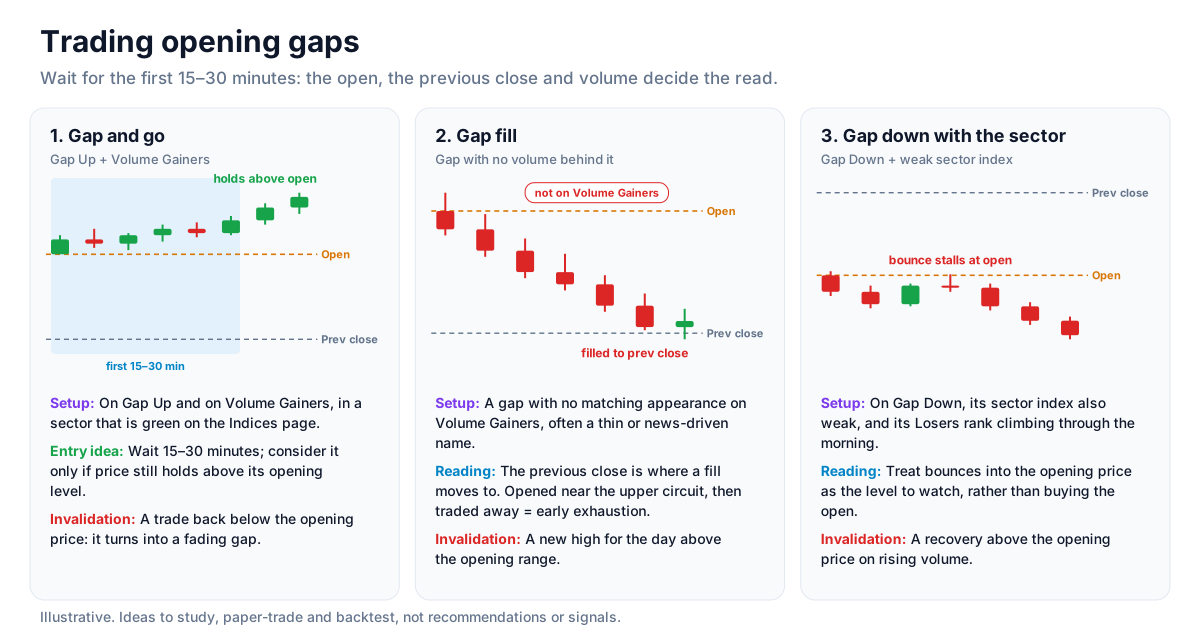
These are ideas to study, paper-trade and backtest, not recommendations or signals, and not a promise of any result. A gap can hold or fill on the same day, and the opening print says nothing certain about the close. Size, entries, exits and risk are your own decisions.
1. Gap and go
- Setup: A stock on Gap Up that also ranks on Volume Gainers, in a sector that is green on the Indices page.
- Entry idea: Wait for the first 15–30 minutes; consider it only if the price is still holding above its opening level.
- Invalidation: A trade back below the opening price, which turns it into a fading gap.
2. Gap fill
- Setup: A gap with no matching appearance on Volume Gainers, often a thinly traded or news-driven name.
- Reading: The previous close is the level a fill moves towards; a gap up that opened near its upper circuit and then traded away from it is the early-exhaustion case.
- Invalidation: The price making a new high for the day above the opening range.
3. Gap down with the sector
- Setup: A stock on Gap Down whose sector index is also weak and whose Losers tab rank keeps climbing through the morning.
- Reading: Treat bounces into the opening price as the level to watch rather than buying the open.
- Invalidation: A recovery above the opening price on rising volume.
How to test these
Load past sessions with the date picker, list the Gap Up and Gap Down names, and record how many held their open, filled to the previous close or did neither. Split the results by whether the stock was also on Volume Gainers.
Where to go next
Read what volume gainers measure and how pre-open market data is read, or go back to the equity data guide. Try the Movers page free.
How to Read This Data
The movers screen ranks stocks by the size of their price change, their volume and their opening gap. It shows where the market's attention was concentrated in a session. Studying it helps explain the difference between a move with broad participation and a short-lived spike in a thinly traded stock.
- Compare the percentage change with volume or turnover: a large move on low turnover usually reflects few participants.
- Notice whether a name appears across several tabs (gainers, volume gainers, most active) or in only one of them.
- Look at where the price sits within the day's range; a close near the high and a close near the low describe very different sessions.
- Review the same list on the following sessions to see how often large movers continued, paused or reversed.
Limitations: A ranking describes what already happened. It does not explain why a stock moved, and it cannot tell whether a move will continue or reverse.
More from the blog
- Strategy Backtesting on Unfluke
Backtest trading strategies on real Indian market data with Unfluke. Test equity, Nifty, Bank Nifty and options strategies with realistic costs and key metrics.
- Live Market Scanners
Explore Unfluke's real-time stock scanner for NSE markets. Scan 1,800+ stocks with 40+ technical indicators, fundamental filters, F&O data and custom rules.
- Option Strategy Simulator
Build and simulate multi-leg options strategies with Unfluke. Visualize payoffs, Greeks, max profit and loss, and replay historical option data from 2023.