Market Terminal
Tracking Repeat Buyers: Client-Level Bulk Deal Research
8 min read · Updated 2 Nov 2026
A single bulk deal is a data point; a client that keeps showing up is a pattern. This article walks through a simple, manual way to build that pattern from the Large Deals page. It builds on how to read bulk and block deals.
Keep a weekly log
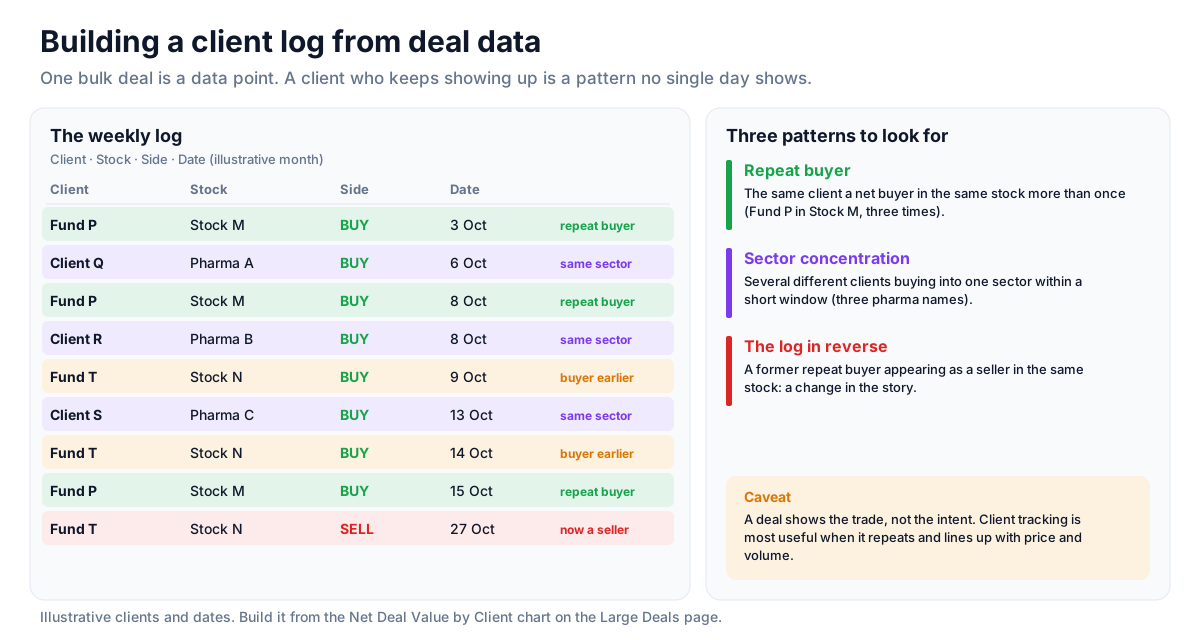
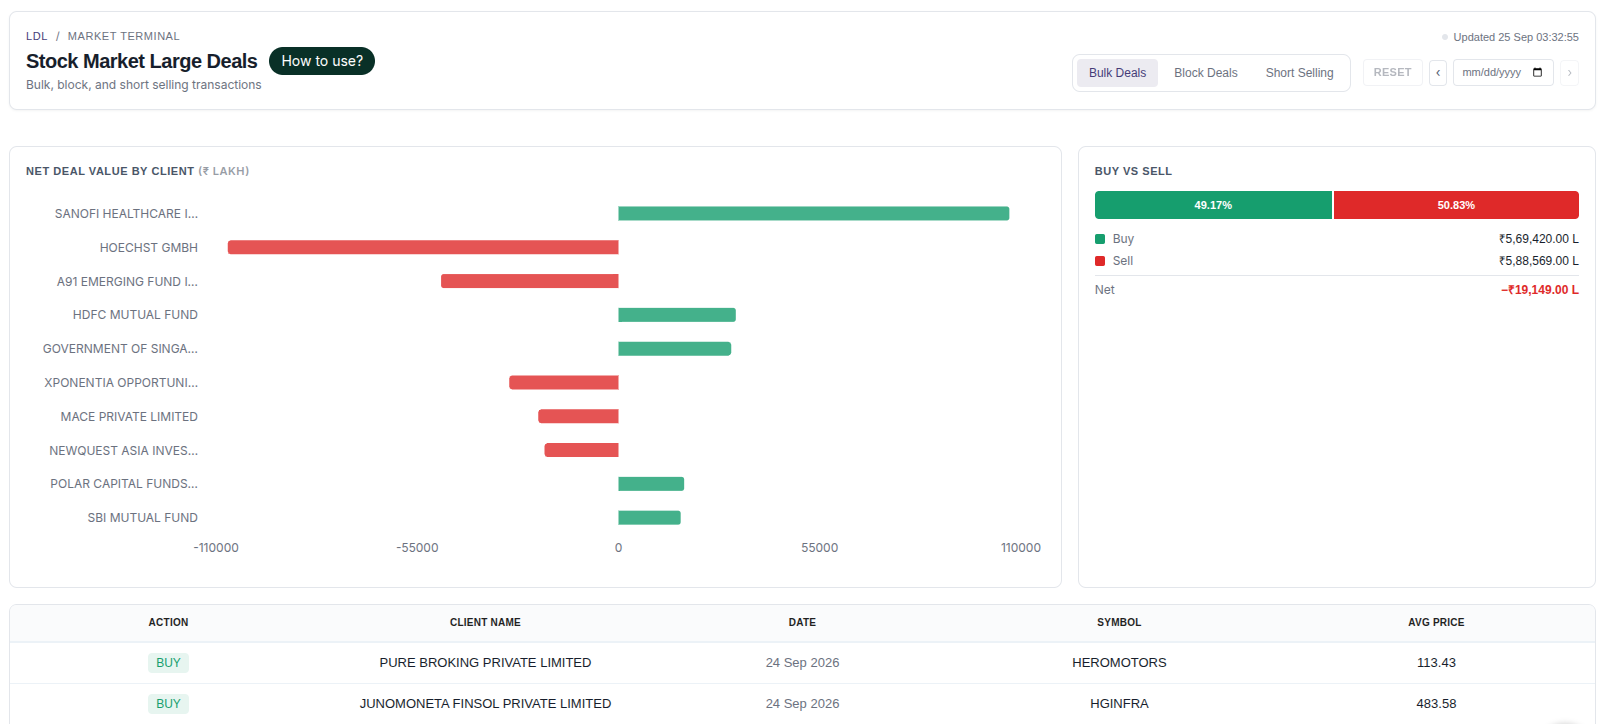
Once a week, scan the Net Deal Value by Client chart and note any client that appears as a net buyer (or seller) in the same stock more than once, or across several stocks in the same sector. A simple log - client, stock, side, date - builds over a month into a picture no single day shows.
Look for sector concentration
Sometimes the pattern is several different clients buying into the same sector within a short window. That points to a broader institutional interest in the sector, and it pairs naturally with sector rotation seen on the heatmap. Two independent data sources pointing the same way carry more weight than either alone.
The same log works in reverse
A client that was a repeat buyer and later appears as a seller in the same stock is equally informative. A shift in a stock's Buy vs Sell split after a period of steady buying is worth noting as a change in the story.
Caveats worth remembering
Deal disclosures show the trade, not the intent. A client may be rebalancing a fund, exiting for unrelated reasons, or trading on behalf of many investors. Client tracking is most useful when it repeats and when it lines up with independent price and volume evidence.
Strategy ideas (ideas, not promises)
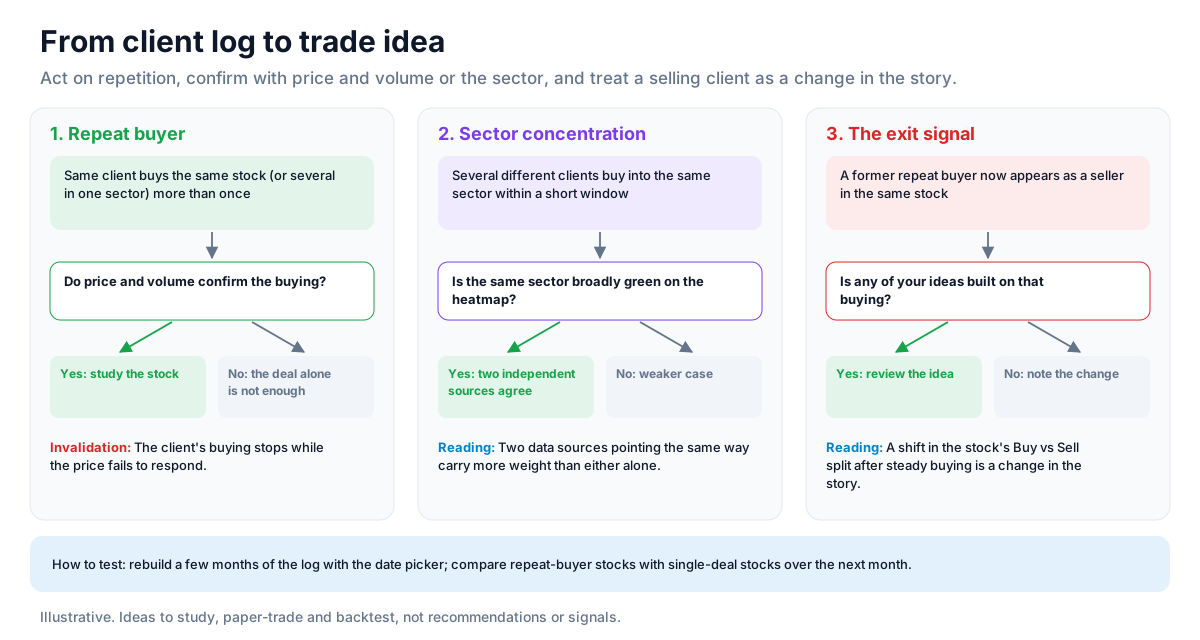
These are ideas to study, paper-trade and backtest, not recommendations or signals, and not a promise of any result. A client may trade for reasons that have nothing to do with the stock's outlook. Size, entries, exits and risk are your own decisions.
1. Build the log, then act on repetition
- Setup: A client in your weekly log buying the same stock more than once, or several stocks in one sector.
- Entry idea: Study the stock when its price and volume confirm the buying, rather than on the deal alone.
- Invalidation: The client's buying stopping while the price fails to respond.
2. Sector concentration
- Setup: Several different clients buying into the same sector within a short window.
- Reading: Check the heatmap's sector view: the same sector showing broad green is two independent sources agreeing.
3. The exit signal
- Setup: A former repeat buyer appearing as a seller in the same stock.
- Reading: Treat it as a change in the story and review any idea built on that buying.
How to test these
Rebuild a few months of the log from past sessions with the date picker and check whether repeat-buyer stocks did better over the following month than single-deal stocks.
Where to go next
Return to how to read bulk and block deals or the equity data guide. Sign up free to start your own log.
How to Read This Data
Bulk and block deals are large transactions that exchanges must disclose, with the client name, quantity and price. Analysts study them to understand who is transacting in size, and whether the price was at a discount or premium to the market.
- Compare the deal price with the stock's closing price to see whether it was struck at a discount or premium.
- Compare the deal quantity with the stock's average daily volume to judge how large it really was.
- Note whether the same client appears repeatedly across sessions.
- Read short-selling disclosures alongside deals to see both sides of the activity.
Limitations: Disclosures show a transaction, not the reason behind it. A deal can be a portfolio rebalance, a promoter transfer or a hedge, and it says nothing about the client's future actions.
More from the blog
- Strategy Backtesting on Unfluke
Backtest trading strategies on real Indian market data with Unfluke. Test equity, Nifty, Bank Nifty and options strategies with realistic costs and key metrics.
- Live Market Scanners
Explore Unfluke's real-time stock scanner for NSE markets. Scan 1,800+ stocks with 40+ technical indicators, fundamental filters, F&O data and custom rules.
- Option Strategy Simulator
Build and simulate multi-leg options strategies with Unfluke. Visualize payoffs, Greeks, max profit and loss, and replay historical option data from 2023.