Market Terminal
Most Active by Value vs Volume: Reading Institutional Churn
8 min read · Updated 2 Nov 2026
The Most Active tab on the Movers page has a By Value / By Volume switch on its chart panel. These are two separately ranked NSE lists - one by traded value (turnover) and one by traded quantity - not one list sorted two ways.
Comparing them is one of the simplest ways to get a sense of who is active in a stock.
Two rankings, two stories
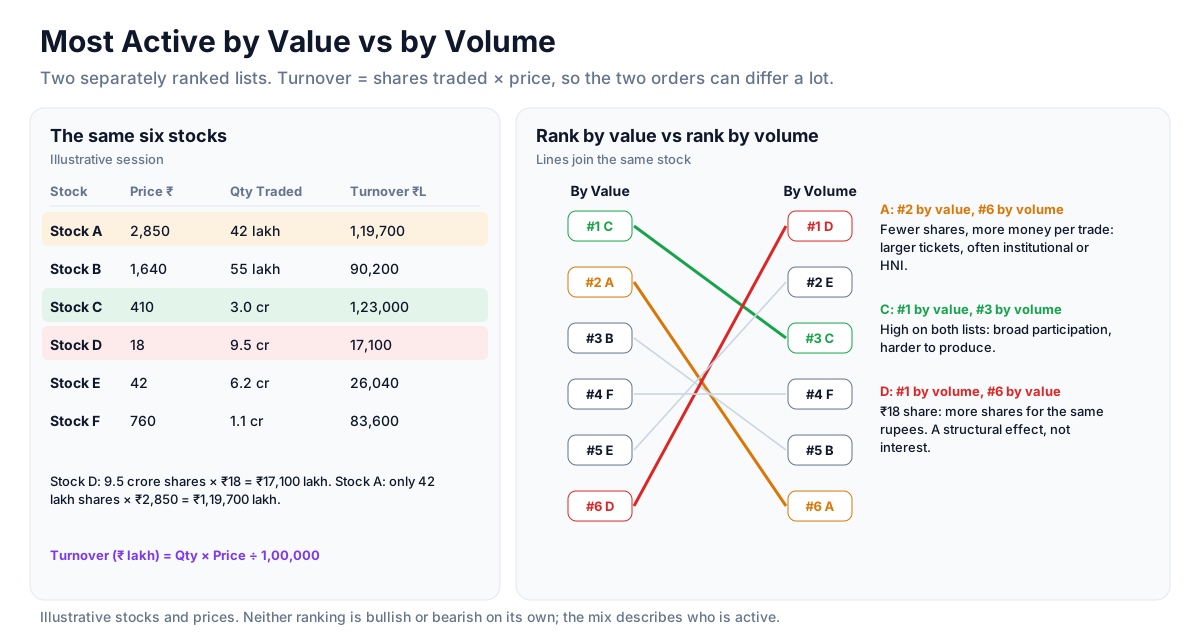
A stock high on the by-value list but lower on the by-volume list is trading in larger ticket sizes - fewer shares, more money per trade - which is often associated with institutional or HNI activity. A stock high by volume but lower by value is seeing many smaller trades, more typical of retail interest or a low-priced share. Neither is bullish or bearish on its own; the mix simply describes the participation. Both views show Qty Traded and Turnover (₹L) so the two can be compared row by row.
Cross-checking with Large Deals
When a stock ranks unusually high by value, the Large Deals page may show a matching bulk or block deal for that day. If it does, the value spike came from a specific named transaction rather than broad market interest - a different piece of information. See how to read bulk and block deals.
The low-priced stock effect
A very low-priced share can dominate the by-volume list simply because more shares change hands for the same rupee amount. That is a structural effect, not a signal. Checking where the same name sits on the by-value list first keeps that effect from being misread.
Reading the overlap
Stocks appearing high on both lists show broad participation across small and large trade sizes, which is harder to produce than either alone. To understand why, analysts usually look at the gap direction and the sector context on the Nifty 50 heatmap.
Strategy ideas (ideas, not promises)
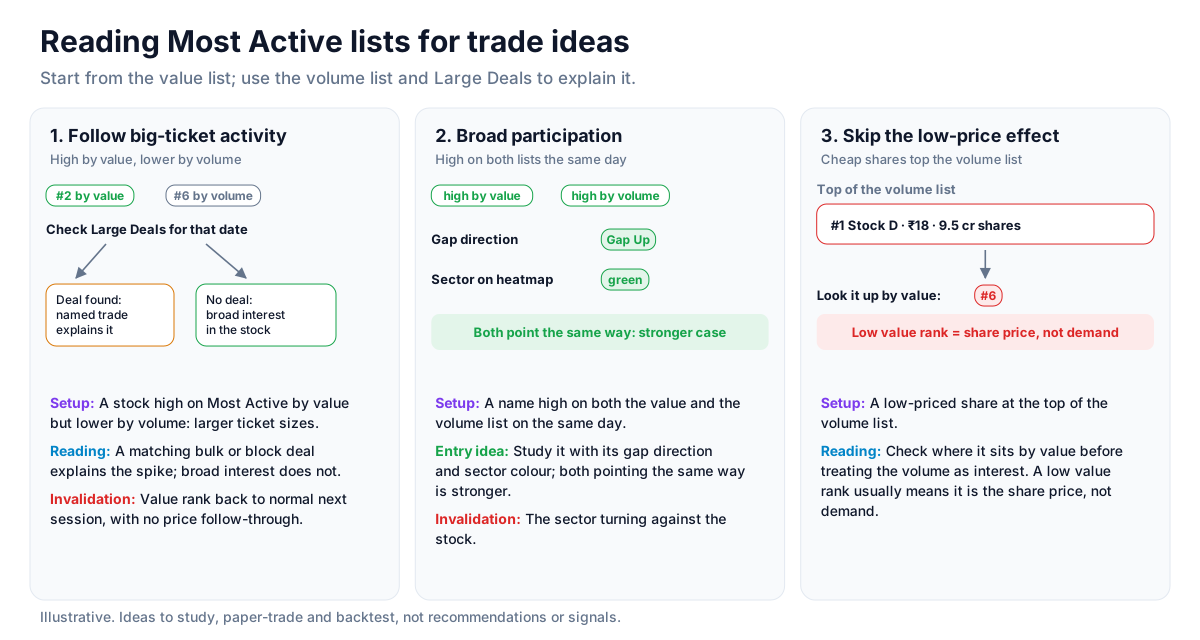
These are ideas to study, paper-trade and backtest, not recommendations or signals, and not a promise of any result. Who is active in a stock is a description, not a forecast of the next move. Size, entries, exits and risk are your own decisions.
1. Follow big-ticket activity
- Setup: A stock high on Most Active by value but lower by volume, which points to larger ticket sizes.
- Reading: Check Large Deals for a matching bulk or block deal; a named transaction explains the spike, broad interest does not.
- Invalidation: The value rank dropping back to normal the next session with no follow-through in price.
2. Broad participation on both lists
- Setup: A name high on both the value and the volume list on the same day.
- Entry idea: Study it alongside its gap direction and sector colour on the heatmap; both pointing the same way is the stronger case.
- Invalidation: The sector turning against the stock.
3. Skip the low-price effect
- Setup: A low-priced share at the top of the volume list.
- Reading: Look up where it sits by value before treating the volume as interest; a low value rank usually means it is the share price, not demand.
How to test these
On past sessions, note the names that ranked high by value but not by volume, and compare what they did over the following week with names that ranked high only by volume.
Where to go next
Continue with bulk and block deals, or return to the equity data guide. Sign up free to see both rankings live.
How to Read This Data
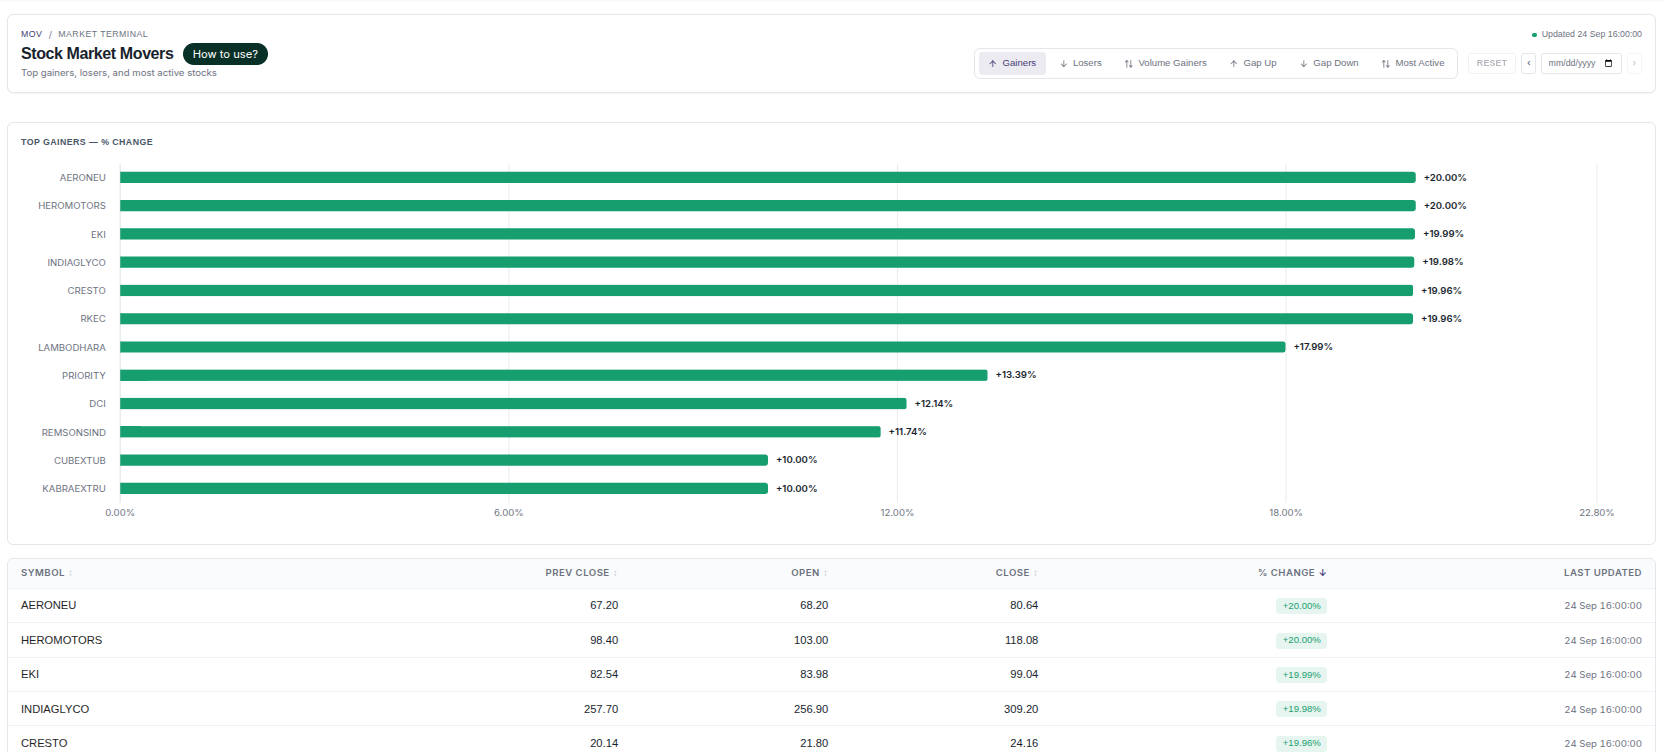
The movers screen ranks stocks by the size of their price change, their volume and their opening gap. It shows where the market's attention was concentrated in a session. Studying it helps explain the difference between a move with broad participation and a short-lived spike in a thinly traded stock.
- Compare the percentage change with volume or turnover: a large move on low turnover usually reflects few participants.
- Notice whether a name appears across several tabs (gainers, volume gainers, most active) or in only one of them.
- Look at where the price sits within the day's range; a close near the high and a close near the low describe very different sessions.
- Review the same list on the following sessions to see how often large movers continued, paused or reversed.
Limitations: A ranking describes what already happened. It does not explain why a stock moved, and it cannot tell whether a move will continue or reverse.
More from the blog
- Strategy Backtesting on Unfluke
Backtest trading strategies on real Indian market data with Unfluke. Test equity, Nifty, Bank Nifty and options strategies with realistic costs and key metrics.
- Live Market Scanners
Explore Unfluke's real-time stock scanner for NSE markets. Scan 1,800+ stocks with 40+ technical indicators, fundamental filters, F&O data and custom rules.
- Option Strategy Simulator
Build and simulate multi-leg options strategies with Unfluke. Visualize payoffs, Greeks, max profit and loss, and replay historical option data from 2023.