Market Terminal
NSE Symbol Change List: Find a Stock's Old and New Symbol
7 min read · Updated 18 Nov 2026
A stock you follow disappears from your watchlist, or an old tip names a symbol your broker cannot find. Usually the company has not vanished - its NSE trading symbol has changed.
The Symbol Changes tab on Market Info lists every stock symbol change NSE has recorded since 1999, with the old symbol, the new symbol, the company and the date it took effect. This guide explains why symbols change and how to use the list.
What is an NSE symbol change?
Every listed stock trades under a short code - its symbol, such as INFY or TATACONSUM. When a company changes its name, rebrands or restructures, NSE often gives it a new symbol. From the effective date the old symbol stops trading and the same shares trade under the new one.
A pure rename does not change the number of shares you hold or their price. It only changes the code you search for. If a rename comes with a merger, split or other corporate action, that action is announced separately - check the Corporate Actions tab for it.
Why it matters to a trader
- Old tips and videos. A strategy or stock idea from a few years ago may use a symbol that no longer trades. The list tells you what it is called now.
- Charts and backtests. Price history is filed under the symbol in use on each day. If a chart or backtest of the new symbol seems to start suddenly, or a gap appears around the rename date, check whether the stock traded under another symbol before.
- Old records. Contract notes, tax statements and spreadsheets from before the change show the old symbol. The list lets you match them to the stock you hold today.
How to read the Symbol Changes tab
- Effective Date - the first day the new symbol traded. Newest changes are at the top.
- Old Symbol / New Symbol - the code before and after the change.
- Company - the company's name as NSE lists it.
Type an old symbol, a new symbol or part of a company name in the search box. The search returns the stock's whole chain, so searching TATACONSUM also shows TATATEA → TATAGLOBAL. Try it: TATACONSUM's symbol history.
The date picker shows only the changes that had taken effect by the date you pick. The list covers stocks only: NSE's file also includes mutual fund schemes, ETFs, bonds and InvITs, which are left out. It is refreshed from NSE every night.
Three quick checks
1. A symbol your broker cannot find
Search the old symbol. If it appears in the Old Symbol column, the row gives the symbol it trades under now.
2. A chart that starts too late
Search the stock. If it has an earlier symbol, the history before the effective date was recorded under that symbol.
3. Your watchlist after a rename
Look at the newest rows at the top of the list now and then. A stock you track may have a new symbol, and alerts or scans set on the old one may stop matching.
Where to go next
Read the corporate actions calendar explained for dividends, splits and bonuses, or how to read pre-open market data for the rest of Market Info. Search the symbol change list free.
How to Read This Data
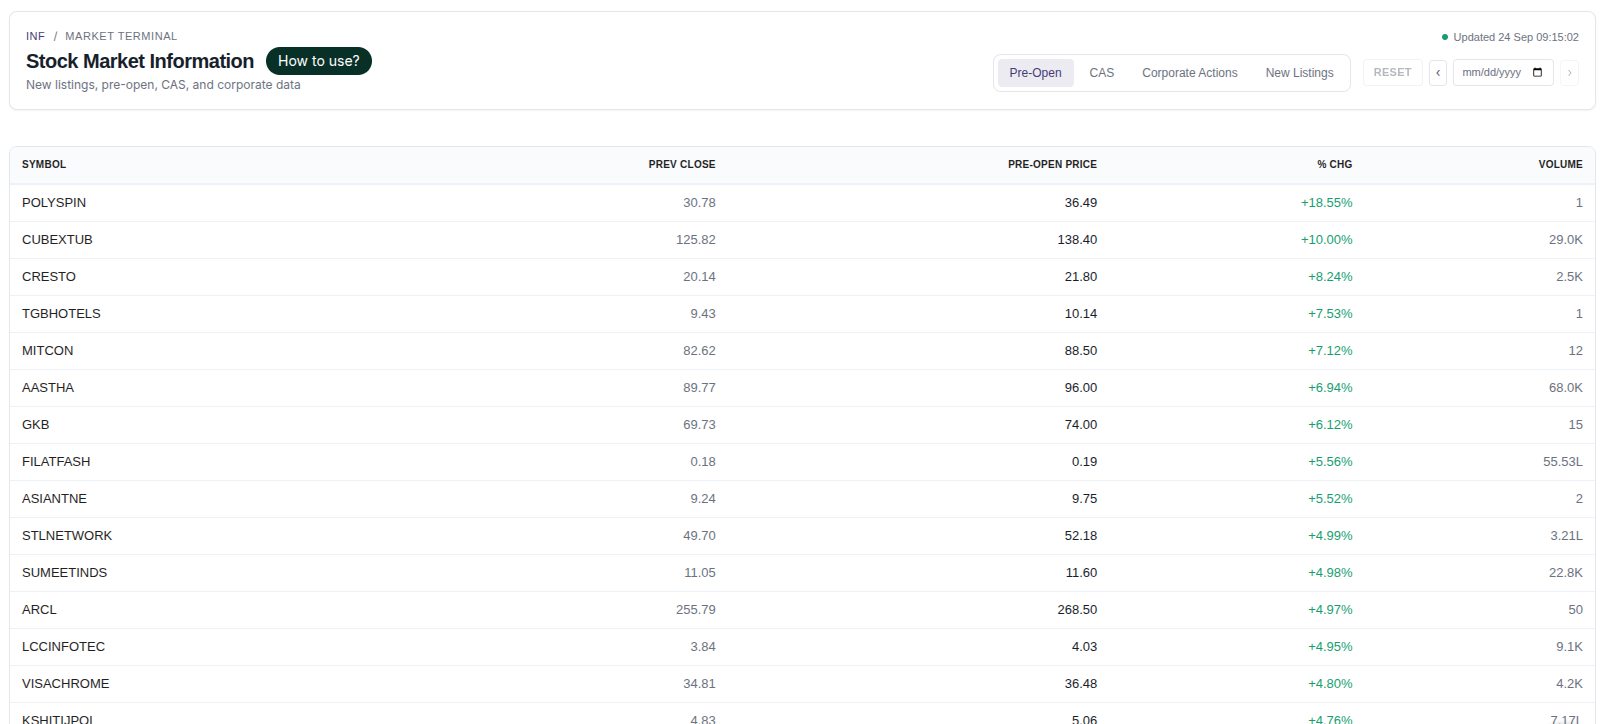
The market information screen collects session context: pre-open prices, the closing auction, corporate actions, stock symbol changes and new listings. These events explain many price moves that look unusual on a chart, such as a drop on an ex-dividend date.
- Use the pre-open data to see how the opening price was discovered before continuous trading began.
- Check corporate actions (dividends, splits, bonuses) before interpreting a sudden price change.
- Note new listings and other session events that can change normal liquidity.
- Compare the closing-session price with the last traded price to understand how the close was set.
Limitations: Event data explains context; it cannot tell how the market will react to an event. Some actions are announced well before they show up in prices.
More from the blog
- Strategy Backtesting on Unfluke
Backtest trading strategies on real Indian market data with Unfluke. Test equity, Nifty, Bank Nifty and options strategies with realistic costs and key metrics.
- Live Market Scanners
Explore Unfluke's real-time stock scanner for NSE markets. Scan 1,800+ stocks with 40+ technical indicators, fundamental filters, F&O data and custom rules.
- Option Strategy Simulator
Build and simulate multi-leg options strategies with Unfluke. Visualize payoffs, Greeks, max profit and loss, and replay historical option data from 2023.