Market Terminal
Reading the PCR Trend Alongside Price
7 min read · Updated 2 Nov 2026
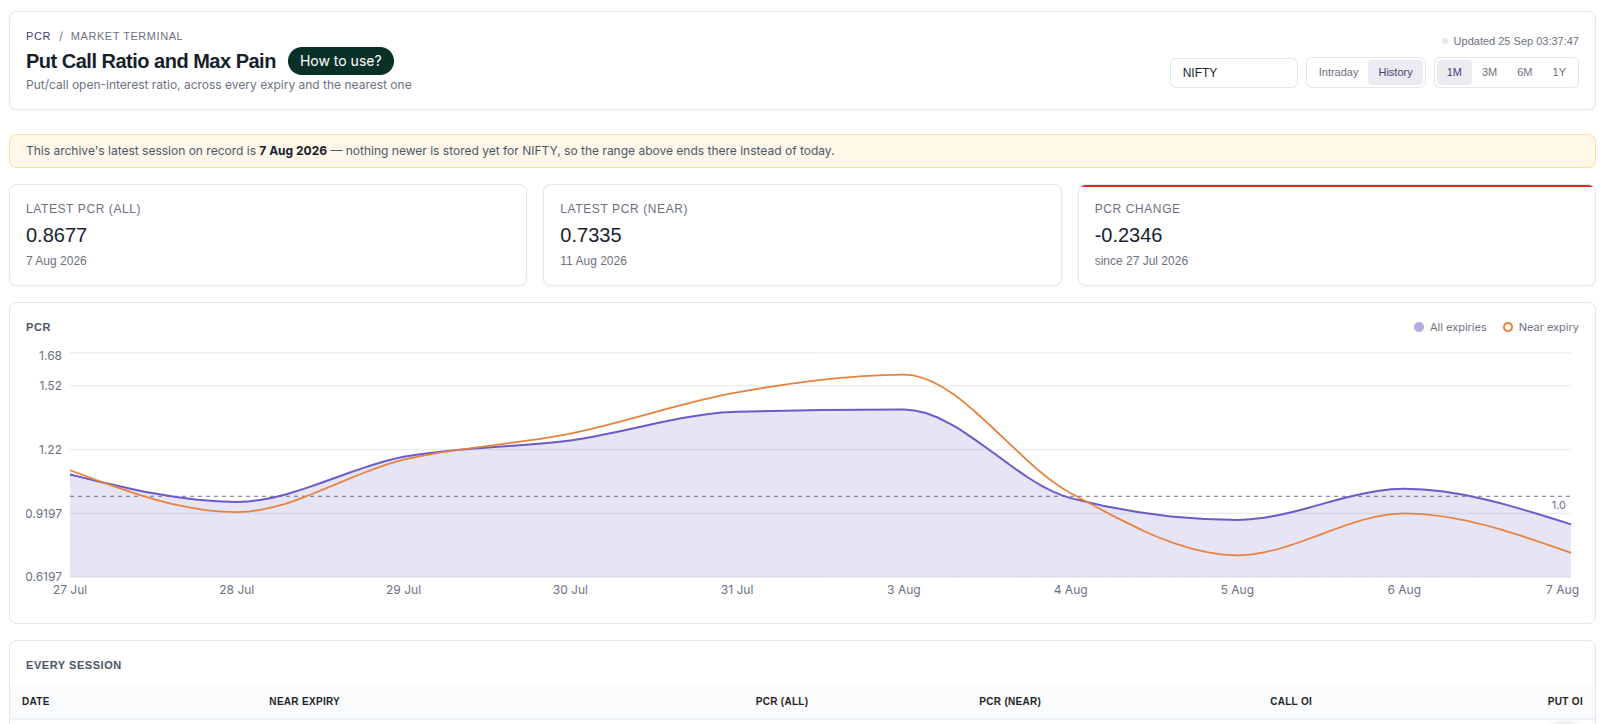
Beyond extreme readings, the put call ratio is also studied for its direction over time. The History view on Unfluke's PCR & Max Pain page includes a PCR Change card built for exactly this.
This article explains how the PCR trend is usually read next to price.
Level vs direction
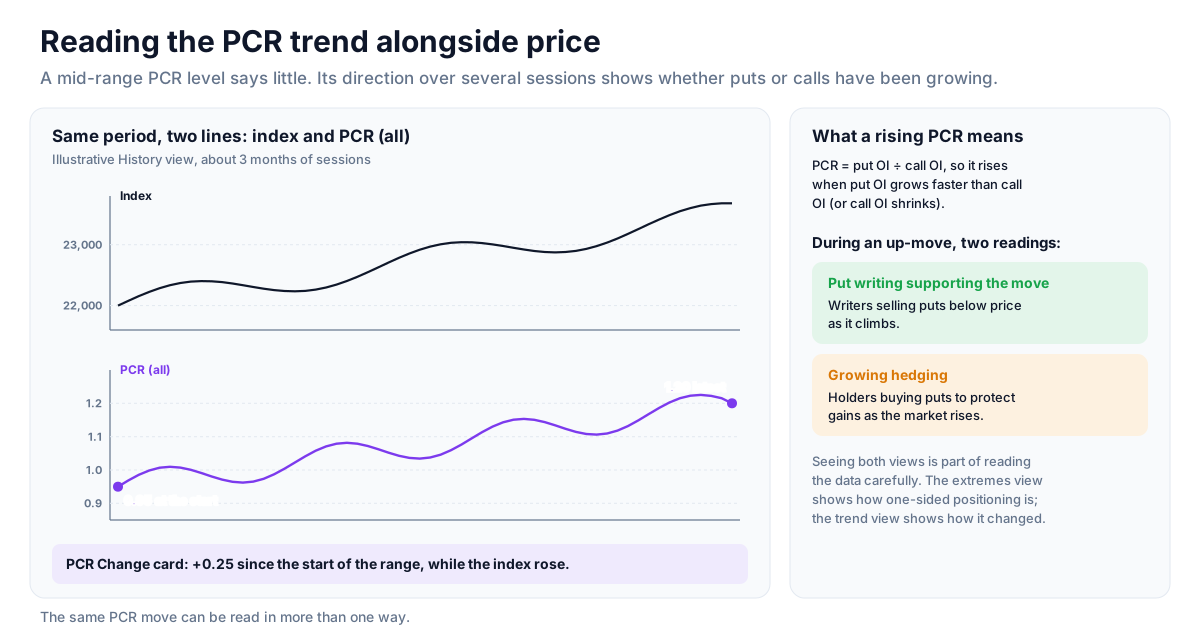
A PCR reading in the middle of its normal range says little on its own. The direction it has been moving over several sessions adds information - whether put positioning has been growing or shrinking relative to calls while price did what it did.
Comparing PCR direction with the price trend
When studying an index trend on the Indices page or through relative strength, a common step is to check whether PCR moved in a consistent way over the same period. Some analysts read rising PCR during an up-move as put writing supporting the move; others read it as growing hedging. Seeing both views is part of reading the data carefully.
When PCR and price disagree
A clear difference between the PCR trend and the price trend is usually treated as a question to investigate rather than an answer - for example, by checking Call OI and Put OI in the Every Session table to see which side actually changed.
Combining trend and extreme readings
The two views complement each other: the extreme-reading view highlights when positioning is unusually one-sided, and the trend view shows how positioning has been changing during a move.
Strategy ideas (ideas, not promises)
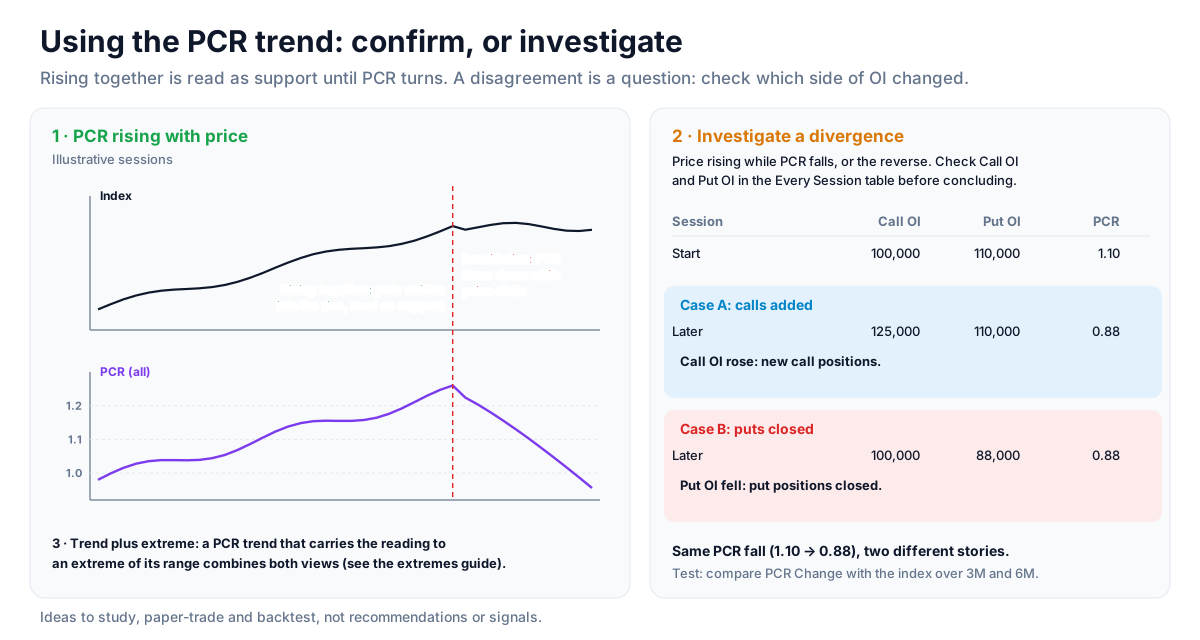
These are ideas to study, paper-trade and backtest, not recommendations or signals, and not a promise of any result. The same PCR move can be read in more than one way. Size, entries, exits and risk are your own decisions.
1. PCR rising with price
- Setup: the index rising over several sessions while PCR Change is positive.
- Reading: puts being written into the rise, often read as support for the move.
- Invalidation: PCR turning down while price stalls.
2. Investigate a divergence
- Setup: price rising while PCR falls, or the reverse.
- Idea: check Call OI and Put OI in the Every Session table to see which side actually changed before drawing a conclusion.
3. Trend plus extreme
- Reading: a PCR trend that carries the reading to an extreme of its range combines both views; see the extremes guide.
How to test these
Use the History view over 3M and 6M ranges and compare PCR Change with the index's moves on the Indices page over the same sessions.
Where to go next
Read near-expiry vs all-expiry PCR next, or return to the derivatives data guide. Try the PCR page free.
How to Read This Data
The put-call ratio (PCR) divides put open interest by call open interest; max pain is the strike at which option holders as a group would lose the most at expiry. Both summarise how options positions are distributed, and analysts use them to study sentiment.
- Compare PCR for the nearest expiry with PCR across all expiries; they can differ meaningfully.
- Track how PCR changed through the session rather than reading one value.
- Note how far max pain sits from the current price and whether it moves as expiry approaches.
- Read both measures alongside the open-interest distribution they are built from.
Limitations: PCR and max pain are summary statistics of positioning, not predictions. Unusual readings can persist, and the index often settles far from max pain.
More from the blog
- Strategy Backtesting on Unfluke
Backtest trading strategies on real Indian market data with Unfluke. Test equity, Nifty, Bank Nifty and options strategies with realistic costs and key metrics.
- Live Market Scanners
Explore Unfluke's real-time stock scanner for NSE markets. Scan 1,800+ stocks with 40+ technical indicators, fundamental filters, F&O data and custom rules.
- Option Strategy Simulator
Build and simulate multi-leg options strategies with Unfluke. Visualize payoffs, Greeks, max profit and loss, and replay historical option data from 2023.