Market Terminal
Near-Expiry vs All-Expiry PCR: Why the Gap Matters
7 min read · Updated 2 Nov 2026
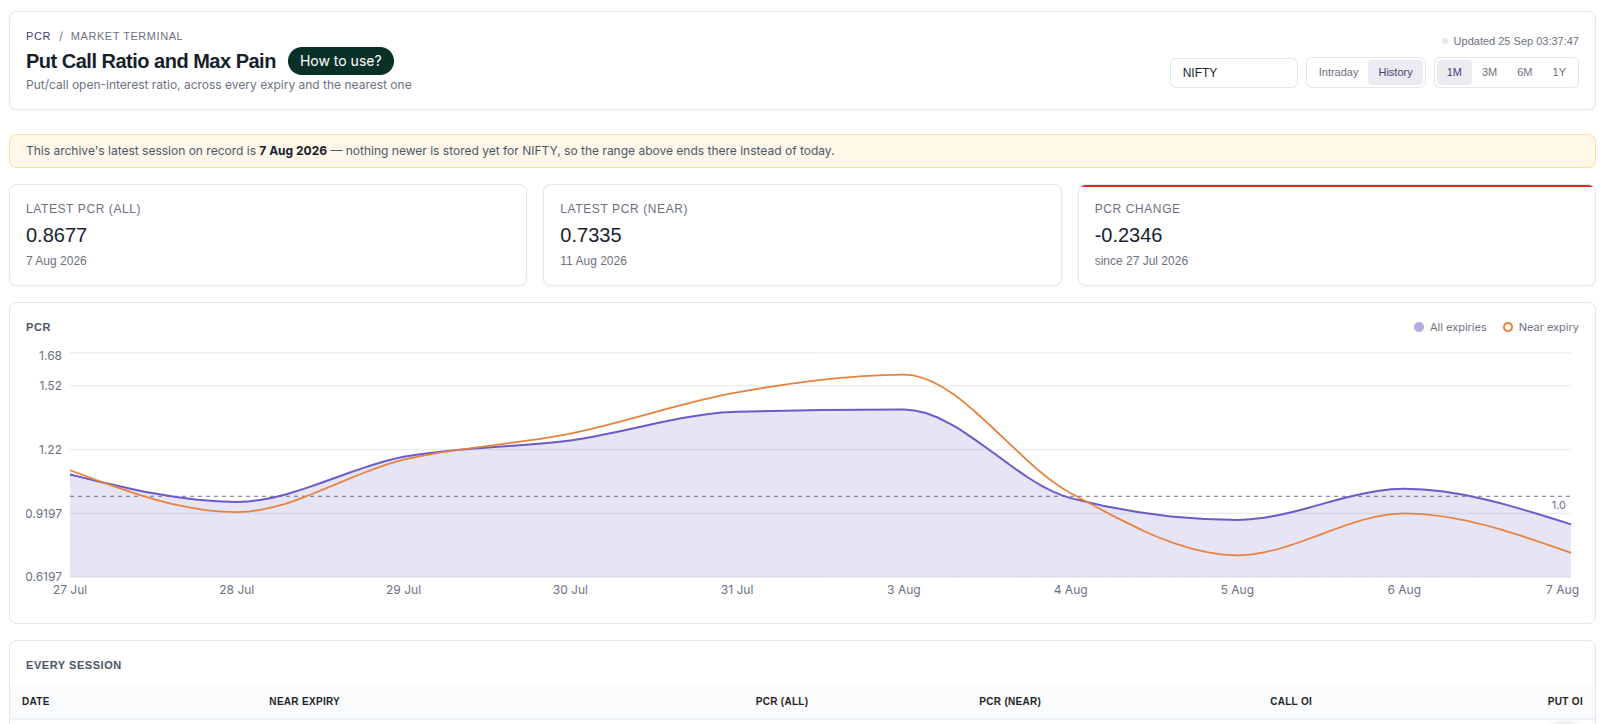
Most PCR sources show a single number. Unfluke's PCR & Max Pain page shows two - PCR across all expiries and PCR for the nearest expiry - in the stat cards, the chart and the Every Session table.
This article explains what each measures and how the gap between them is usually read.
Why the two numbers can differ
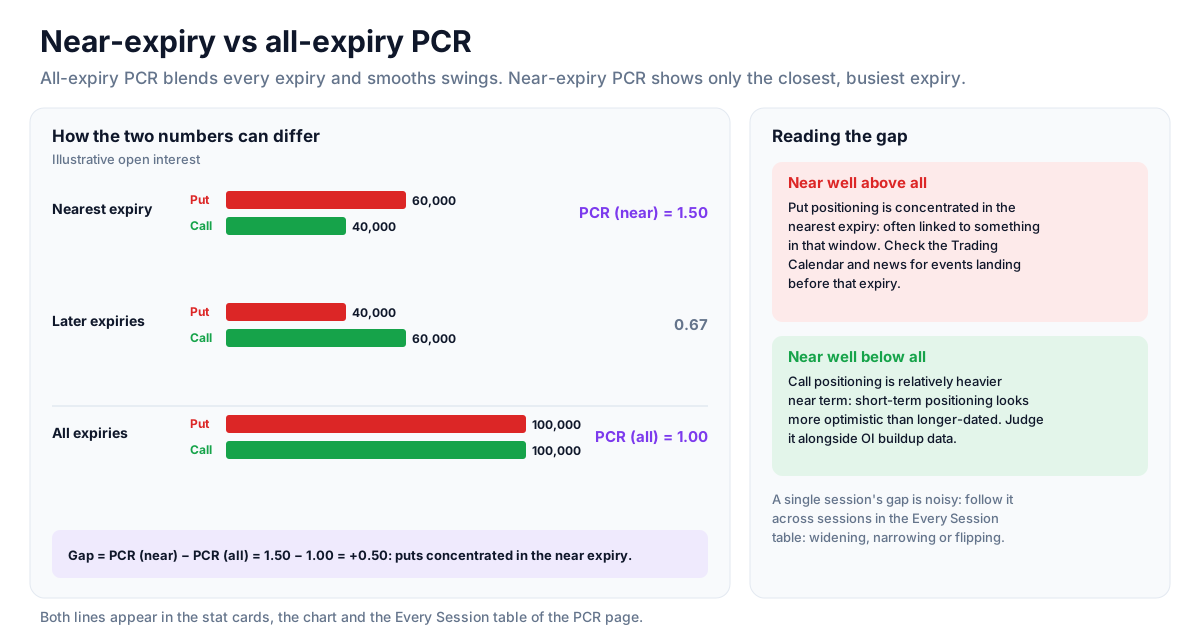
All-expiry PCR blends near-term and longer-dated positions, which smooths out short-term swings. Near-expiry PCR looks only at the closest expiry, where activity is usually heaviest and most sensitive to short-term events. When they diverge, near-term positioning has shifted differently from the broader book.
When near-expiry PCR is well above all-expiry PCR
This means put positioning is concentrated in the nearest expiry. It is often linked to something specific in that window rather than a broad change in outlook, so a common first step is to check the Trading Calendar and the news for events landing before that expiry.
When near-expiry PCR is well below all-expiry PCR
Here call positioning is relatively heavier in the nearest expiry than across the whole book - short-term positioning looking more optimistic than longer-dated positioning. Whether that persists is easier to judge alongside open interest buildup data.
Tracking the gap
A single session's gap is noisy. Following it across several sessions in the Every Session table - widening, narrowing or flipping - is more informative, in the same way a PCR trend says more than one day's level.
Strategy ideas (ideas, not promises)
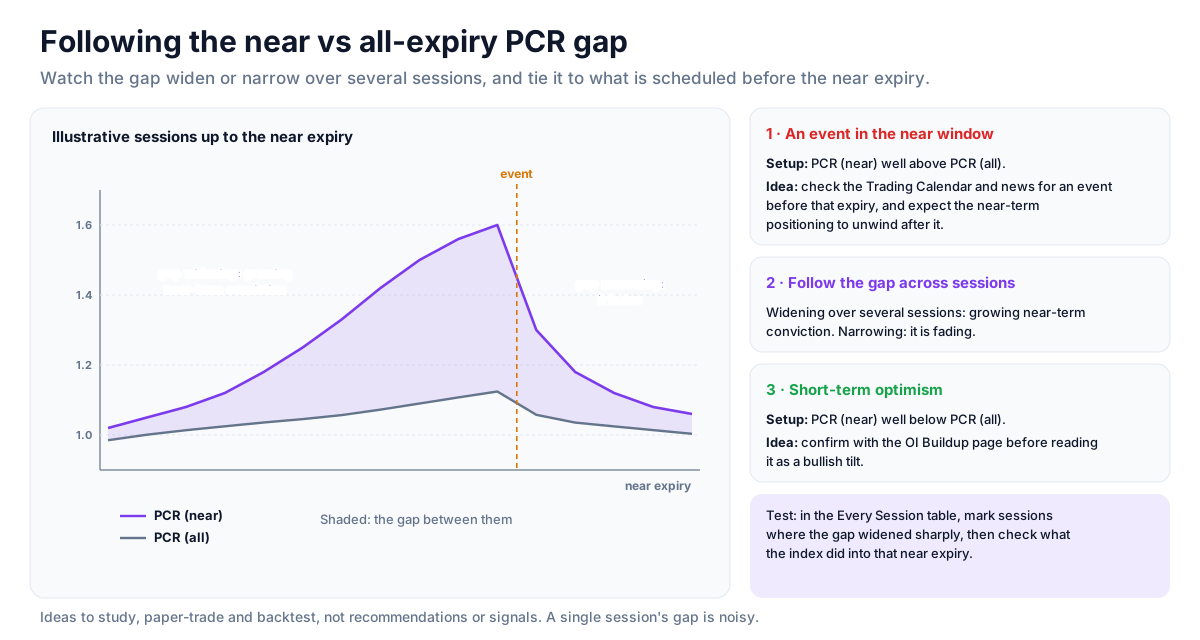
These are ideas to study, paper-trade and backtest, not recommendations or signals, and not a promise of any result. A single session's gap is noisy. Size, entries, exits and risk are your own decisions.
1. An event in the near window
- Setup: PCR (near) well above PCR (all).
- Idea: check the Trading Calendar and news for an event before that expiry, and expect the near-term positioning to unwind after it.
2. Follow the gap across sessions
- Reading: a gap that widens over several sessions shows growing near-term conviction; a gap that narrows shows it fading.
3. Short-term optimism
- Setup: PCR (near) well below PCR (all).
- Idea: confirm with the OI Buildup page before reading it as a bullish tilt.
How to test these
In the Every Session table, mark sessions where the gap widened sharply, then check what the index did into that near expiry.
Where to go next
Return to put call ratio explained and the PCR trend, or the derivatives data guide. Try the PCR page free.
How to Read This Data
The put-call ratio (PCR) divides put open interest by call open interest; max pain is the strike at which option holders as a group would lose the most at expiry. Both summarise how options positions are distributed, and analysts use them to study sentiment.
- Compare PCR for the nearest expiry with PCR across all expiries; they can differ meaningfully.
- Track how PCR changed through the session rather than reading one value.
- Note how far max pain sits from the current price and whether it moves as expiry approaches.
- Read both measures alongside the open-interest distribution they are built from.
Limitations: PCR and max pain are summary statistics of positioning, not predictions. Unusual readings can persist, and the index often settles far from max pain.
More from the blog
- Strategy Backtesting on Unfluke
Backtest trading strategies on real Indian market data with Unfluke. Test equity, Nifty, Bank Nifty and options strategies with realistic costs and key metrics.
- Live Market Scanners
Explore Unfluke's real-time stock scanner for NSE markets. Scan 1,800+ stocks with 40+ technical indicators, fundamental filters, F&O data and custom rules.
- Option Strategy Simulator
Build and simulate multi-leg options strategies with Unfluke. Visualize payoffs, Greeks, max profit and loss, and replay historical option data from 2023.