Market Terminal
Understanding Volatility Around Quarterly Results
8 min read · Updated 2 Nov 2026
The session after a results announcement is often a stock's largest move of the quarter. Two things drive it: the surprise in the numbers, and the collapse of the implied volatility priced in beforehand. Combining the Result Calendar with the Option Chain makes both visible.
This article explains the mechanics.
IV crush: the part directional views often miss
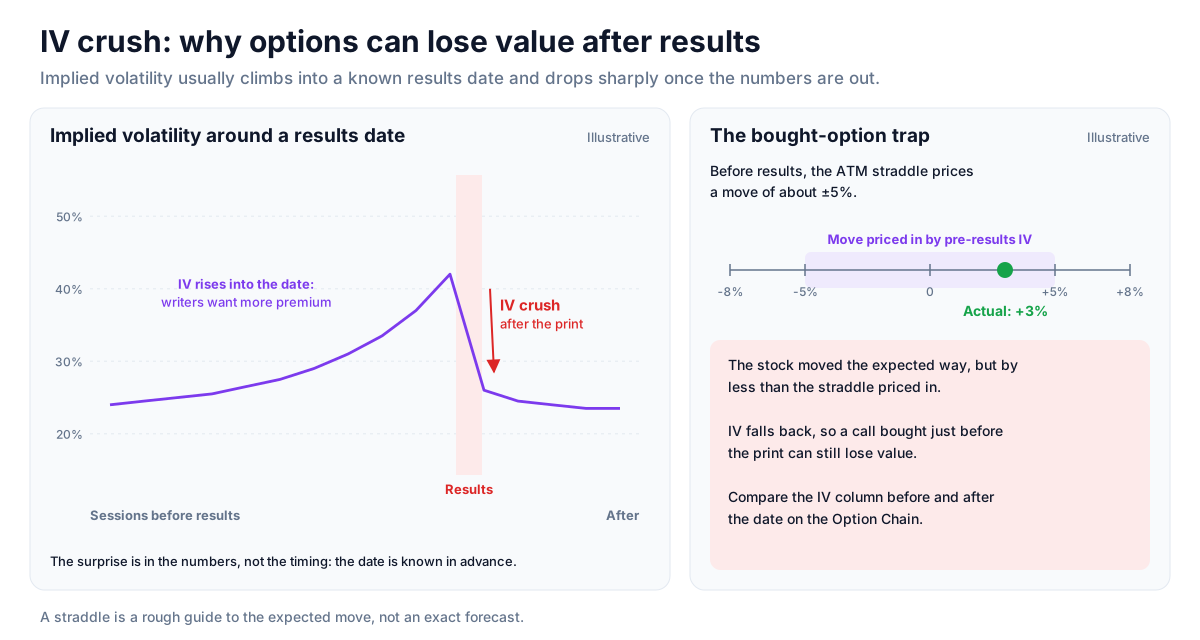
Once results are out and uncertainty resolves, implied volatility usually drops sharply whichever way the stock moves - an effect known as IV crush. An option bought just before the print can lose value even if the stock moves in the expected direction, when the move is smaller than what pre-event IV had priced in. Comparing the IV column before and after a results date shows the effect directly.
Reading the move after the print
The first minutes after results can be erratic. Once price discovery settles, the stock's place on the Movers page and its category on the OI Buildup page help describe the reaction - a move accompanied by fresh long or short buildup reflects new positioning, while a move with falling open interest reflects positions being closed.
Known dates, known risk
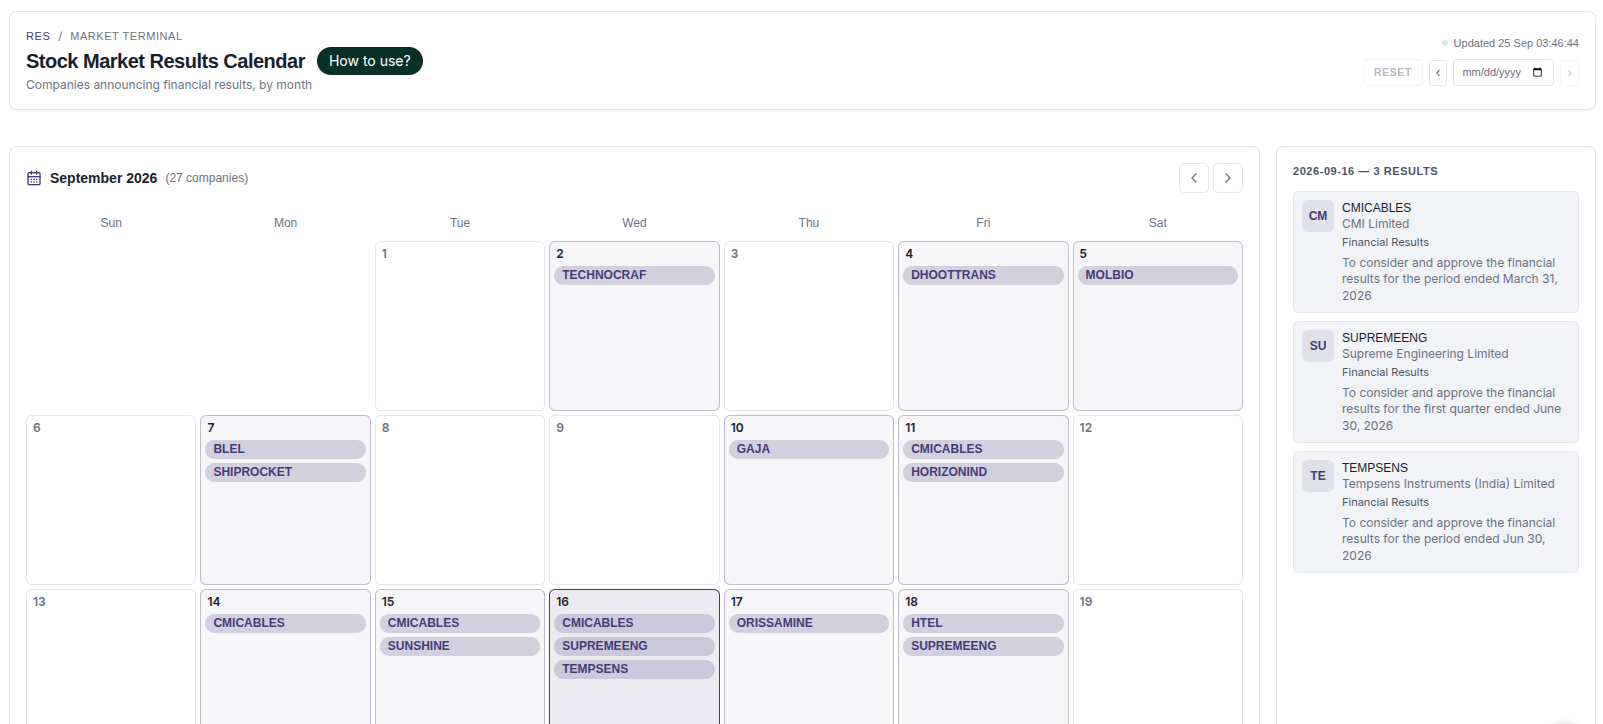
Because results dates are published ahead of time, the surprise is in the numbers, not the timing. Checking the Result Calendar regularly keeps those dates visible for any stock being studied.
Strategy ideas (ideas, not promises)
These are ideas to study, paper-trade and backtest, not recommendations or signals, and not a promise of any result. Options can lose value after results even when the stock moves the expected way. Size, entries, exits and risk are your own decisions.
1. Compare the expected move with the actual move
- Setup: before results, note the ATM straddle premium on the Option Chain as a rough guide to the move the market has priced in.
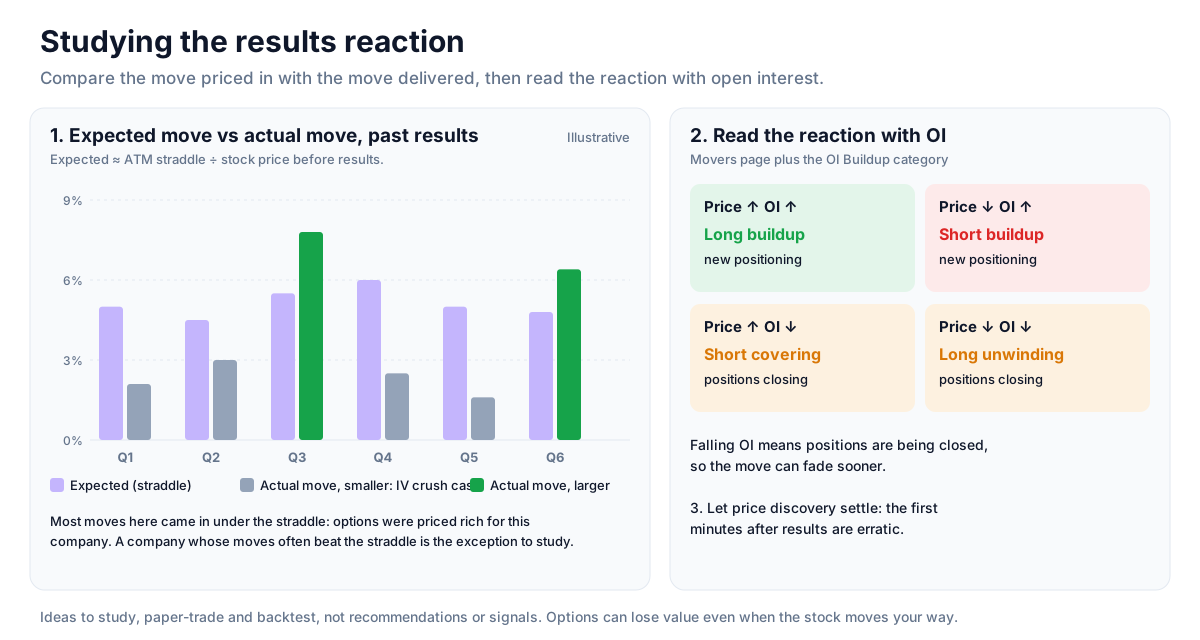
- Reading: after results, compare the actual move with that figure. A move smaller than the straddle is the IV crush case.
- Use: this tells you whether options were priced rich or cheap for that company's results over time.
2. Avoid buying options just before the print by default
- Reading: implied volatility usually rises into results and falls after them, so a bought option needs a move larger than what was priced in.
- Invalidation: a company whose results moves have regularly exceeded the straddle is the exception worth studying.
3. Read the reaction with open interest
- Setup: after the numbers, check the stock on the Movers page and its category on the OI Buildup page.
- Reading: a move with fresh long or short buildup reflects new positioning; a move with falling OI reflects positions being closed, which can fade sooner.
4. Wait for price discovery to settle
- Reading: the first minutes after results are erratic; ideas based on the reaction are steadier once the opening swings have passed.
How to test these
For past results of F&O stocks, note the IV and straddle premium before the date and the IV after it on the Option Chain at those past dates, then compare with the actual price move on the Historical Charts.
Where to go next
How to Read This Data
A result calendar shows when listed companies are scheduled to announce their quarterly results. Results can change expectations about a business, which is why prices often move more than usual around these dates.
- Note the result dates for companies you are studying.
- Compare the price move on result days with the stock's typical daily move.
- Read the results filing itself; the calendar only gives the date.
- Remember that companies sometimes reschedule; check the exchange filing for the confirmed date.
Limitations: The calendar shows timing, not content. It cannot indicate whether results will be good or bad, or how the market will react.
More from the blog
- Strategy Backtesting on Unfluke
Backtest trading strategies on real Indian market data with Unfluke. Test equity, Nifty, Bank Nifty and options strategies with realistic costs and key metrics.
- Live Market Scanners
Explore Unfluke's real-time stock scanner for NSE markets. Scan 1,800+ stocks with 40+ technical indicators, fundamental filters, F&O data and custom rules.
- Option Strategy Simulator
Build and simulate multi-leg options strategies with Unfluke. Visualize payoffs, Greeks, max profit and loss, and replay historical option data from 2023.