Market Terminal
FII Derivative Positioning: How Long or Short Foreign Investors Are in Index Futures
11 min read · Updated 9 Nov 2026
The daily FII/DII figures everyone quotes are cash-market numbers: how many crore of shares foreign and domestic institutions bought or sold. They say nothing about the much larger bets placed in futures and options. For that, NSE publishes a second report every evening, the participant-wise open interest: how many index and stock futures and options contracts each type of trader holds long and short.
The FII Derivative Positioning page turns that report into a few numbers you can read in a minute: what share of FII index-futures contracts are long, their net position, how their index options lean, and where all of it sits against FII history and the Nifty 50. This guide explains each number, reads the real 6 November 2026 session (the end of a sharp short-covering rally), and turns it into a workflow and strategy ideas. For the cash-market side, see the FII/DII divergence guide.
What participant-wise open interest is
Four kinds of trader, one TOTAL row
Every trading evening NSE's clearing corporation publishes a file that splits the whole equity-derivatives open interest between four client types:
- FII: foreign portfolio investors.
- DII: domestic institutions such as mutual funds, insurers and banks.
- Pro: brokers trading on their own book (proprietary desks).
- Client: everyone else, mostly retail and other non-institutional accounts.
For each it gives the contracts held long and short in index futures, stock futures, index calls and puts and stock calls and puts. Every contract has a buyer and a seller, so the four rows always add up: if FIIs are heavily short index futures, someone else, usually Clients, holds the other side.
It counts contracts, not rupees
The report counts contracts, and it does not split index futures by index. A NIFTY future and a BANKNIFTY future each count as one, whatever their value. The page shows the numbers as NSE reports them and says so; treat them as a measure of positioning, not of money at risk.
The numbers the page derives
- Long % = index-futures long ÷ (long + short). 50% means balanced; below 50% means net short.
- Net = long − short, in contracts.
- Calls net / puts net = index calls (or puts) held long minus written.
- Options tilt = calls net − puts net. Positive when FIIs hold long calls or short puts (a bullish lean), negative when they hold long puts or short calls.
- Stock futures net = FII long minus short in single-stock futures.
Long % against its own history
A level only means something against what is normal for it. The page ranks today's FII long % against every stored session since January 2024 (the percentile) and, once more than 250 sessions are stored, against the last year as well. With at least 60 sessions stored it also labels the level from the full-history percentile: Extremely long at the 90th percentile or above, Longer than usual at 70 or above, Shorter than usual at 30 or below, Extremely short at 10 or below, and Around its usual level in between.
Reading the real numbers: 6 November 2026
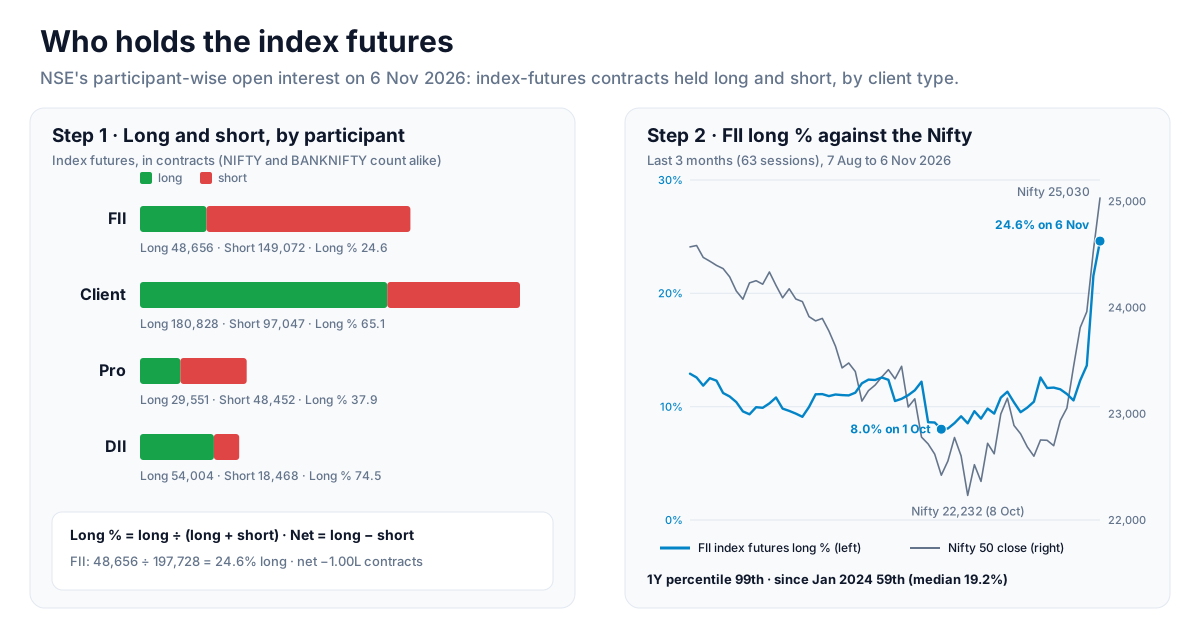
The Nifty 50 closed at 25,030.35 on 6 November, up 2.01% on the day and 12.6% above its 8 October low of 22,231.80. The page's cards that evening read:
- FII index futures long %: 24.6%, up 3.06 points on the day. FIIs held 48,656 contracts long and 149,072 short.
- FII index futures net: −1.00L (−100,416 contracts), +37.0K on the day.
- FII options tilt: −5.77L. Calls net −1.28L (more calls written than bought), puts net +4.50L (more puts bought than written): the options book still leaned defensive.
- Long % percentile: 59th of 705 sessions since 1 January 2024, range 5.98% to 83.85%, and the 99th over the last year.
- Client / Pro long %: 65.1% / 37.9%. Client net +83.8K, Pro net −18.9K.
The story in the change, not the level
On 22 October FIIs held only 9.92% of their index-futures contracts long, with a net short of 2.80 lakh contracts. Over the next eleven sessions the short leg fell from 315,003 to 149,072 contracts while the long leg barely moved (34,703 to 48,656). The net short shrank by almost two-thirds, and the Nifty rose from 22,687.65 to 25,030.35. That is what short covering looks like in this report: the short leg shrinking, not the long leg growing.
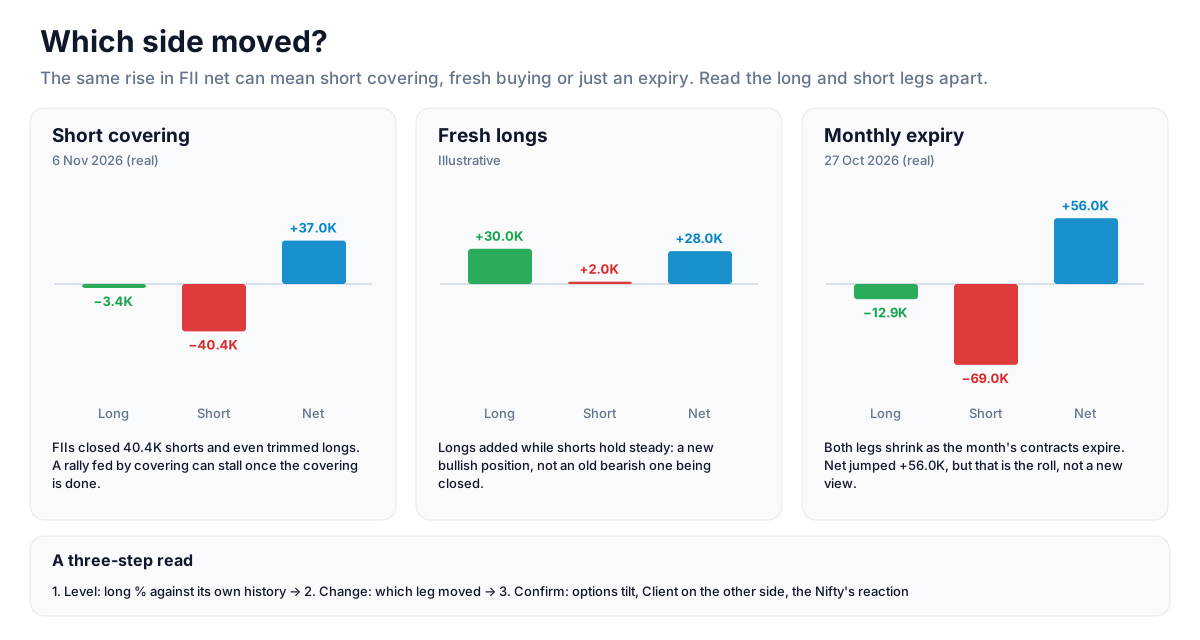
The 6 November row shows it in one day: long −3,381 contracts, short −40,403, net +37,022. Clients were on the other side. Their long % fell from 82.3% on 22 October to 65.1% as they sold the futures FIIs were buying back.
Why the label says "Around its usual level"
Over the last year, 24.6% long is the top 1%: FIIs had been longer on only two sessions, 20 and 23 February 2026. Over the full history it is only the 59th percentile, because from June to October 2024 FIIs often held 50% to 80% of their index-futures contracts long. The label uses the full history, so it reads "Around its usual level". Read both numbers: the one-year percentile says positioning has swung hard, the long one says FIIs are still net short in absolute terms.
An expiry day looks different
On 27 October, the monthly expiry, FII net jumped by 56,048 contracts. It was not a change of view: the long leg fell from 46,522 to 33,588 and the short leg from 323,627 to 254,645 as the October contracts expired and were not all rolled. When both legs shrink together on an expiry, read the roll, not the net.
How to use it in a trade
The page is a backdrop for index trades, not a timing tool. A workable routine:
- Read the level against history. Note the long %, the full-history percentile and the one-year percentile. Extremes matter most: a crowded short has fuel for covering rallies, a crowded long has room to unwind.
- Split the change into its legs. Use the "Positions on" table or the session table. Net up because shorts closed is covering; net up because longs were added is fresh buying. Covering rallies can run hard and then stall once the shorts are gone; fresh longs tend to be the steadier signal.
- Check the calendar. On a monthly expiry both legs shrink as contracts lapse (see the trading calendar guide). Compare the session after expiry with the session before it instead.
- Confirm with the options tilt. Futures turning up while puts net keeps rising means FIIs are covering futures but still buying protection. Agreement between the two is stronger than either alone.
- Look at who is on the other side. Client long % usually moves opposite to FII long %. A Client long % at its highs while FIIs are deeply short is the classic crowded arrangement.
- Watch the Nifty's reaction. The correlation note on the chart tells you how closely FII long % and the Nifty have tracked over the range. On 6 November, over 3 months, it was 0.46, and the day's change in FII net against the Nifty's % change was 0.59. Positioning and price have moved together, but far from one for one.
The report arrives in the evening, after the close, so every reading is about yesterday's positions. Use it to frame the next session, not to react inside it.
Strategy ideas (ideas, not promises)
These are ideas to study, paper-trade and backtest, not recommendations or signals, and not a promise of any result. FII positioning can stay at an extreme for weeks, and contract counts mix NIFTY and BANKNIFTY with no regard to value. Size, entries, exits and risk are your own decisions.
1. Fade the extreme, with confirmation
- Setup: FII long % in the bottom 10% of its full history (the "Extremely short" label) and the first session where the short leg shrinks.
- Idea: treat it as the possible start of covering; look for long index setups on your own chart rules rather than entering on the report alone.
- Invalidation: the short leg growing again the next session, or the Nifty making a new low.
2. Covering exhaustion
- Setup: after a run like late October to 6 November 2026, net change slows (smaller daily covering) while the Nifty is still rising.
- Reading: when the short leg stops shrinking, the buyer that drove the move is gone. Tighten trailing stops on longs rather than adding.
- Test: mark every past session where FII net rose for five or more sessions, then see how the Nifty did in the five sessions after the streak ended.
3. Futures and options in agreement
- Setup: FII long % rising and the options tilt rising (calls net up, puts net down) over the same week.
- Idea: a cleaner bullish backdrop than futures alone; the mirror image for bearish.
- Invalidation: the two diverging again.
4. Crowding check before an event
- Setup: a scheduled event (policy decision, budget, monthly expiry) with FII long % at either extreme and Clients on the other side.
- Idea: a crowded book tends to move further on surprise. Favour defined-risk positions over naked ones into the event.
How to test these
Set the range to All and export the sessions to CSV. Each row has the Nifty close and change and every FII figure, so you can mark the days that met an idea's setup and measure the Nifty's move over the following 5, 10 and 20 sessions. Backtest the index rules on Unfluke before trading real money.
Every card, chart and table
The control
- Range: 1M (21 sessions), 3M (63, the default), 6M (126), 1Y (250) or All. It sets the charts, the session table and the "over the range" figures. The percentile always uses everything stored.
- Download: the sessions on screen as CSV.
The cards
- FII index futures long %, its change on the day in points and the history label.
- FII index futures net, its change on the day, and the long and short contracts.
- FII options tilt, with calls net and puts net.
- Long % percentile against all stored sessions, the full range, and the one-year percentile once more than 250 sessions are stored.
- Client / Pro long %, with their net positions.
- Nifty 50: the close, its change over the range, and the FII long % change over the same range.
The charts
- FII index futures long % vs Nifty 50, with dashed lines at the 10th and 90th percentile of the full history and the correlation of the two over the range.
- FII net index futures vs Nifty 50, in contracts.
- Index futures long % by participant: FII, Client, Pro and DII on one chart. Above 50% is net long.
- FII index options held net: calls net and puts net as bars, the tilt as a line.
The tables
- Positions on the latest session: for each participant, index futures long, short, net and the day's change, long %, index calls and puts net, options tilt and stock futures net.
- Session by session: date, Nifty close and change, FII long, short, net and net change, FII long %, FII calls and puts net, and Client and Pro long %.
DII stock futures usually show a very large net short. Much of it is the arbitrage funds' hedge (long shares, short futures), not a bearish view; the page's DII index-futures line is the more useful one.
What the numbers are built from
The source is NSE's participant-wise open interest file (fao_participant_oi), stored one document per session from 1 January 2024: 705 sessions to 6 November 2026. A background pass checks for new files every hour; NSE publishes the day's file in the evening, so the newest session appears after the close. While the history is still being collected the page says so, and the longer ranges and the percentile fill in as it arrives. Nifty 50 closes come from NSE's index Bhavcopy. Correlations need at least 10 sessions with both values. All futures and options figures are numbers of contracts, as NSE reports them.
Where to go next
For FII and DII cash-market flows, read the FII/DII divergence guide; for futures buildup by contract, the long vs short buildup guide; for monthly rollovers, the futures rollover guide. Open the page at Market Overview → FII Derivative Positioning, or sign up free to run it yourself.
More from the blog
- Strategy Backtesting on Unfluke
Backtest trading strategies on real Indian market data with Unfluke. Test equity, Nifty, Bank Nifty and options strategies with realistic costs and key metrics.
- Live Market Scanners
Explore Unfluke's real-time stock scanner for NSE markets. Scan 1,800+ stocks with 40+ technical indicators, fundamental filters, F&O data and custom rules.
- Option Strategy Simulator
Build and simulate multi-leg options strategies with Unfluke. Visualize payoffs, Greeks, max profit and loss, and replay historical option data from 2023.