Market Terminal
Dividend Tracker: Yield, Payout, Streak and Dividend Growth for Every NSE Payer
9 min read · Updated 9 Nov 2026
A dividend yield is easy to compute and easy to misread. A 6% yield can come from a steady business paying half its profit, from a company paying out more than it earns, or from a share price that has just halved. The yield alone cannot tell them apart; the payout, the history and the growth can.
The Dividend Tracker shows all of them for every listed Indian company that paid a dividend in the last two fiscal years or has one announced. This guide explains how each number is built (including how old dividends are restated for splits and bonuses), reads the real Coal India, ITC and Castrol rows of 6 November 2026, and shows how to use the page without falling into a yield trap.
What the page measures
Dividend TTM and yield
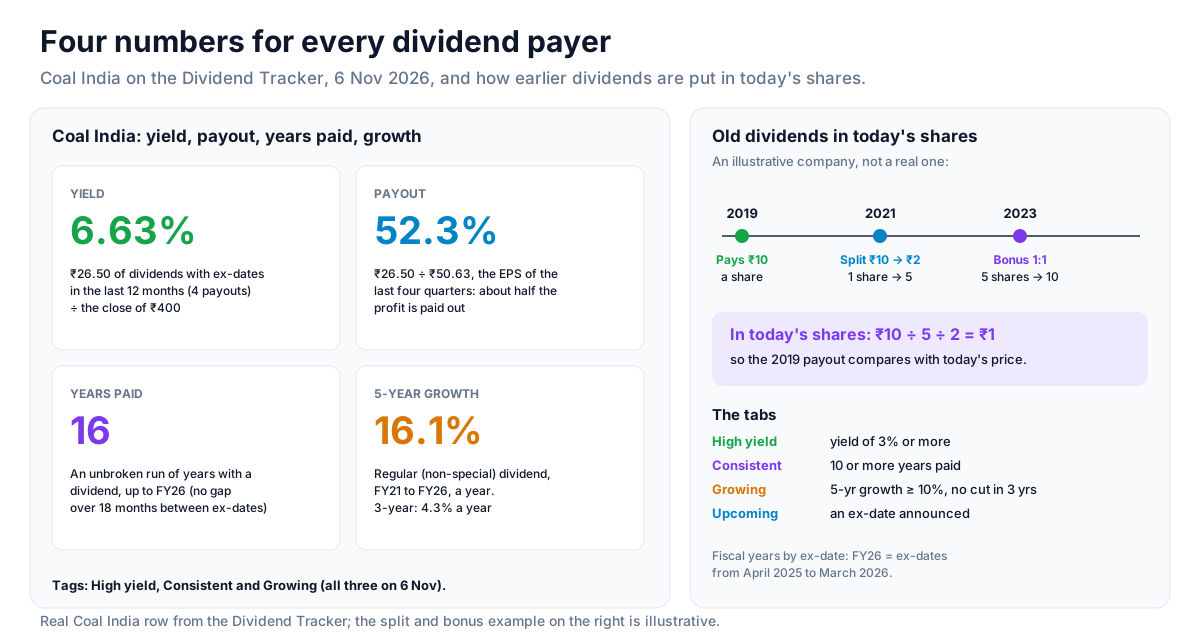
Dividend TTM adds every dividend with an ex-date in the last twelve months (365 days to the newest session). Yield is that ÷ the latest close. Using ex-dates rather than fiscal years means a company that pays an interim and a final always shows a full year's worth, whichever months they fall in. A special dividend inside the window is included and marked "incl. special".
Payout
Payout is Dividend TTM ÷ the earnings per share of the last four quarterly results. It answers "how much of the profit is being paid out?" Over 100% (shown in red) means the company paid more than it earned over the year, from reserves or borrowing. That can last a while, but not for ever.
Years paid
The unbroken run of years with a dividend, counted to the last complete fiscal year. The page walks back from the newest dividend while each one is within 550 days (about 18 months) of the next. That keeps a company whose annual ex-date drifts from March into April from losing its streak to an empty year.
Growth
5Y Growth is the compound yearly growth of the regular dividend (specials left out) from five fiscal years before the last complete one; the three-year figure sits under it. Fiscal years are assigned by ex-date: "FY26" means ex-dates from April 2025 to March 2026.
Today's shares
Every amount is restated to today's share count. If a company split its shares from ₹10 to ₹2 face value (one share became five), dividends paid before the split are divided by 5; a 1:1 bonus (one share became two) divides earlier dividends by 2. So a ₹10 dividend paid before both becomes ₹1 in today's shares, and the whole history compares with today's price. The row panel shows each amount as announced and restated.
The tabs
- High yield: trailing yield of 3% or more.
- Consistent: ten or more years paid.
- Growing: five-year regular dividend growth of 10% a year or more, with no cut (beyond 2%) in any of the last three complete years.
- Upcoming ex-dates: an ex-date announced after the newest session, soonest first.
Worked examples: 6 November 2026
On 6 November 2026 the page listed 1,369 companies; 968 others had paid no dividend recently. 110 were tagged High yield, 435 Consistent, 225 Growing and 32 had an ex-date coming up. 31 had a payout above 100%, and 34 had a special dividend inside their trailing year.
Coal India: all three tags
- Dividend TTM ₹26.50 from four ex-dates, the latest an interim of ₹10.25 on 4 November 2026.
- Yield 6.63% on a close of ₹400.
- Payout 52.3% of trailing EPS of ₹50.63: about half the profit paid out.
- Years paid: 16. 5Y growth 16.1% a year, 3Y 4.3%.
A high yield, covered about twice by earnings, with a long record and growth: this is the profile most income investors want. The open questions are outside the table: coal demand, and government policy on how much its companies pay out.
ITC: high yield, high payout, flat growth
Yield 5.12% (₹14.50 over two ex-dates on a ₹283.15 close), but a payout of 91.5% and five-year growth of −1.1% a year (3Y 5.4%). Almost all of the profit is already paid out, so future dividend growth depends on profit growth. Note also that only splits and bonuses are adjusted for: a demerger, such as ITC's of its hotels business in January 2025, is not, so older amounts are as paid.
Castrol India: paying more than it earns
Yield 6.01% with a payout of 107.1%, and 19 years paid. The dividend exceeded trailing earnings; either profit recovers, or the dividend eventually has to come down.
Two things the top of the list teaches
- Sorted by yield, the All tab opened with yields of 74.6%, 22.6% and 20.2%. Yields that far above the rest are almost always a one-off payout or a thinly traded small company, not repeatable income.
- Upcoming: ONGC (₹8 interim) and Hindustan Unilever (₹19 interim) both had ex-dates on 12 November 2026, and Dabur (₹3.50) on 9 November.
How to use it in a trade
Around the ex-date
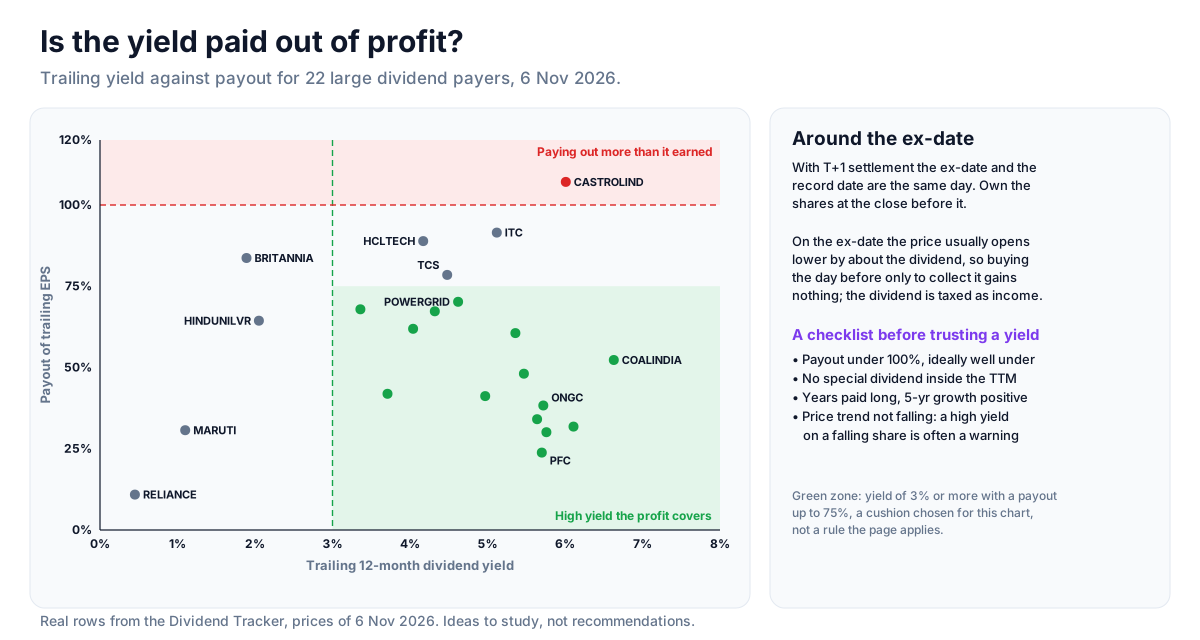
With T+1 settlement, the ex-date and the record date are the same day: you must own the shares at the close of the trading day before. On the ex-date the price usually opens lower by about the dividend, and the dividend is taxed as income at your slab rate. So buying a day before only to collect the dividend gains nothing on its own. The Upcoming tab is for planning, not for a free lunch.
A workflow for income ideas
- Start from Consistent or Growing, not from High yield. A long record and growing payments say more than one year's yield.
- Check the payout. Well under 100% leaves room for a bad year. The chart above shades yields of 3% or more with payouts up to 75%; that cushion is our choice for illustration, not a rule of the page.
- Look for a special. "incl. special" in the Dividend TTM column means the yield will probably fall next year.
- Open the history. The panel's year-by-year bars show cuts, specials and the trend at a glance.
- Check the price trend. A yield that is high because the share price has fallen hard is often a warning about the business. Prefer names whose price is stable or rising.
Strategy ideas (ideas, not promises)
These are ideas to study, paper-trade and backtest, not recommendations or signals, and not a promise of any result. Past dividends are not a promise of future ones, and companies can cut them without notice. Size, entries, exits and risk are your own decisions.
1. Covered yield with a long record
- Setup: yield of 3% or more, payout below 75%, ten or more years paid, no special in the trailing year.
- Reading: income the profit covers, from a company with a habit of paying.
- Invalidation: a dividend cut, a payout climbing toward 100%, or the price losing its 200-day average.
2. Dividend growers
- Setup: the Growing tab (10% a year or more over five years, no cut in three), sorted by 5Y growth, with yield below the high-yield line.
- Reading: a low yield that grows fast can out-earn a high flat one over several years; growth in dividends usually follows growth in profit.
- Entry idea: on a price trigger (a pullback to a rising 50-day average that holds).
3. Yield-trap screen
- Setup: yield of 5% or more with a payout over 100% or a falling five-year growth figure.
- Reading: a list to avoid, or to research before trusting. Check Earnings Quality and the debt in Peer Comparison.
4. Ex-date calendar for positions you already want
- Setup: the Upcoming tab, for stocks already on your buy list for other reasons.
- Reading: timing a planned purchase before or after the ex-date changes whether the dividend (and its tax) is yours; it does not change the economics much. Plan around it rather than trade it.
How to test these
Download the Consistent and Growing tabs every few months and keep them dated. Track each name's total return (price plus dividends) against the Nifty 50 over the following year. The price-side rules can be backtested on Unfluke's backtester for the names the dividend screen selected.
Every tab, filter, column and panel
The tabs and filter
- All: every recent payer, highest trailing yield first.
- High yield, Consistent (longest run first), Growing (fastest growth first), Upcoming ex-dates (soonest first).
- Universe: All, Nifty 50, Nifty Next 50, Nifty Bank, F&O or Nifty 500.
The columns
- Symbol, LTP and Sector.
- Dividend TTM: ₹ per share in the last twelve months, restated for later splits and bonuses, with "incl. special" where it applies.
- Yield: green at 3% or more.
- Payout: red above 100%.
- Years Paid: the unbroken run to the last complete fiscal year.
- 5Y Growth, with the 3-year figure under it.
- Last Ex-Date and Next Ex-Date, each with its amount.
Click a header to sort; the download button saves the current tab as a CSV.
The row panel
Click a row for the company's full record: four summary tiles (Dividend TTM, yield, payout, years paid), bars of dividend per share for up to fifteen fiscal years (regular and special in different colours, the current year marked as partial), and a table of every dividend on record with its ex-date, type, the amount as announced, the amount in today's shares (with the divisor used) and its source.
What the numbers are built from
Dividends from January 2017 come from NSE corporate actions, with the amount read from the announcement text ("Interim Dividend - Rs 4 Per Share"); earlier ones from Capitaline's dividend table. Splits and bonuses come from the same two sources. EPS is the sum of the last four consecutive quarterly results (consolidated when they are as recent as the standalone ones), restated for later splits and bonuses. Prices are the newest NSE Bhavcopy close.
- Older records have gaps. 282 companies show exactly 15 years paid, many of them long-time payers such as Reliance: the older dividend table is missing years around 2010-11, which breaks the run. Read "15" as "at least 15".
- Only splits and bonuses are adjusted. Demergers, rights issues and buybacks are not, so a company that demerged a business shows its older dividends as paid.
- Announcement text. An NSE announcement with no amount in its text ("Interim Dividend") cannot be counted until a later one gives the figure.
- Payout needs four quarters. A company with a missing quarter shows no payout.
Where to go next
For every corporate action on a calendar, read the Dividend & Bonus Calendar guide and the corporate actions guide. To check whether the profit behind the dividend is real, read the Earnings Quality guide; to compare yields within an industry, the Peer Comparison guide. Open the page at Fundamental → Dividend Tracker, or sign up free to open any company's record.
More from the blog
- Strategy Backtesting on Unfluke
Backtest trading strategies on real Indian market data with Unfluke. Test equity, Nifty, Bank Nifty and options strategies with realistic costs and key metrics.
- Live Market Scanners
Explore Unfluke's real-time stock scanner for NSE markets. Scan 1,800+ stocks with 40+ technical indicators, fundamental filters, F&O data and custom rules.
- Option Strategy Simulator
Build and simulate multi-leg options strategies with Unfluke. Visualize payoffs, Greeks, max profit and loss, and replay historical option data from 2023.