Market Terminal
Dividend & Bonus Calendar: Ex-Dates, Record Dates and What Happens to the Price
10 min read · Updated 9 Nov 2026
A company declares a dividend, a bonus or a split, and a date gets fixed: the record date. Whoever is on the company's books that day gets the dividend or the new shares. For a trader the date that matters is the one before it, the last session you can buy and still qualify, and the morning after, when the price opens adjusted.
The Dividend & Bonus Calendar lists every ex-date NSE has on file around today: dividends, bonuses, splits, rights issues, buybacks and demergers, with each dividend set against the share price and each bonus or split turned into a theoretical ex-price. This guide explains the dates, reads real rows from 9 November 2026, and shows how to use the three views.
Record date, ex-date and the last day to buy
The dates in a corporate action
- Announcement: the board approves the dividend, bonus or split and tells the exchange.
- Record date: the company pays, or issues shares, to everyone who is a shareholder on its books at the end of this day.
- Ex-date: the first session in which a buyer no longer gets the benefit. From this session the share trades "ex" the dividend or bonus.
- Payment or allotment: dividends usually reach bank accounts within 30 days of the declaration; bonus shares are credited to demat accounts a few days after the record date.
Why the ex-date equals the record date now
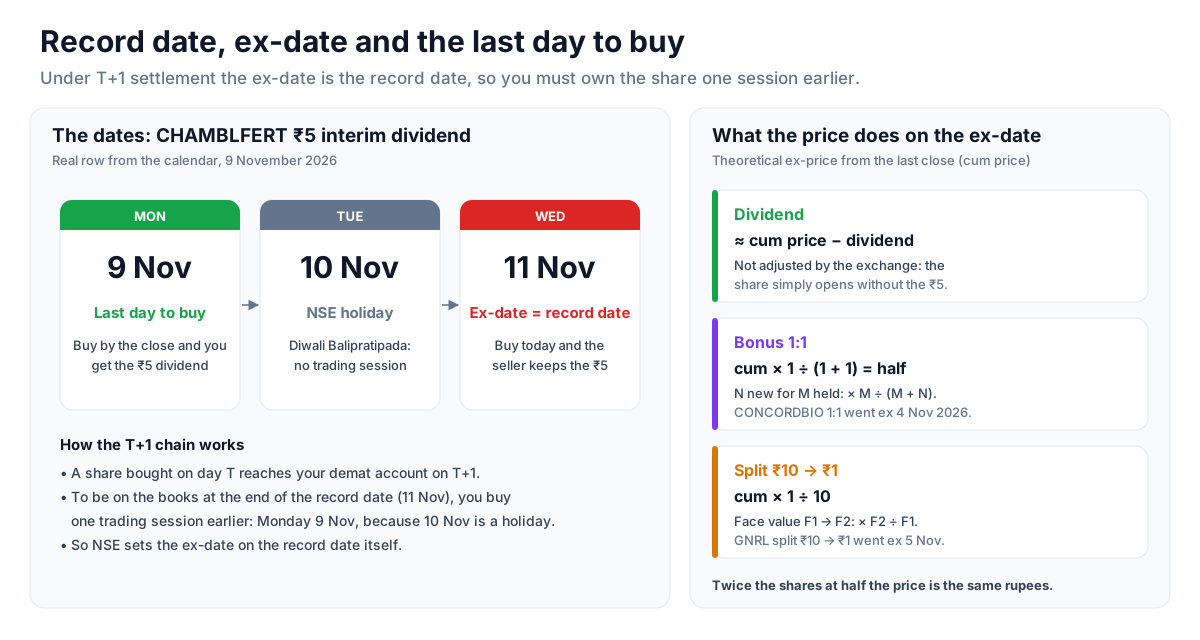
Indian equities settle on T+1: a share you buy today reaches your demat account on the next working day. To be on the books at the end of the record date you have to have bought one session earlier. So NSE sets the ex-date on the record date itself, and the rule for you is simple: buy on or before the session before the ex-date. Buy on the ex-date and the seller keeps the dividend.
"The session before" means a trading session, not a calendar day. CHAMBLFERT's ₹5 interim dividend goes ex on Wednesday 11 November 2026. Tuesday 10 November is an NSE holiday (Diwali Balipratipada), so the last session to buy and still get the ₹5 is Monday 9 November.
What happens to the price on the ex-date
On the ex-date the exchange adjusts nothing for a dividend: the stock simply opens without the right to it, so it tends to open lower by about the dividend, and the day's move is measured from the unadjusted previous close. For bonuses and splits the share count changes, and the price follows it:
- Bonus N:M (N new shares for every M held): theoretical ex-price = price × M ÷ (M + N). A 1:1 bonus halves the price.
- Split from face value F1 to F2: theoretical ex-price = price × F2 ÷ F1. A ₹10 to ₹1 split divides it by ten.
- Consolidation (face value goes up): the same formula, and the price rises.
None of these change what your holding is worth on paper. Twice the shares at half the price is the same rupees. That is why a chart that is not adjusted for a bonus shows a fake 50% crash, and why scanners that compare prices across the ex-date have to adjust for it.
The six actions on the page
- Dividend: interim, final or special, in rupees per share. InvITs and REITs pay "distributions" per unit, listed the same way.
- Bonus: free shares in a ratio, such as 1:1.
- Split: face value sub-divided (or consolidated).
- Rights: the right to buy new shares in a ratio, at a stated premium.
- Buyback: the record date of a tender-offer buyback; holders on it can tender shares.
- Demerger: a business split off into a new listed company.
Reading real rows: 9 November 2026
On Monday 9 November 2026 the default window (the last 7 days and the next 30) held 100 actions: 93 dividends, 1 bonus, 2 splits, 1 rights issue and 3 buybacks. 39 were still ahead and 61 had already gone ex. The furthest ex-date on file was 20 November: NSE lists an action only once its record date is fixed, so the calendar never reaches far ahead.
ONGC: the biggest dividend ahead
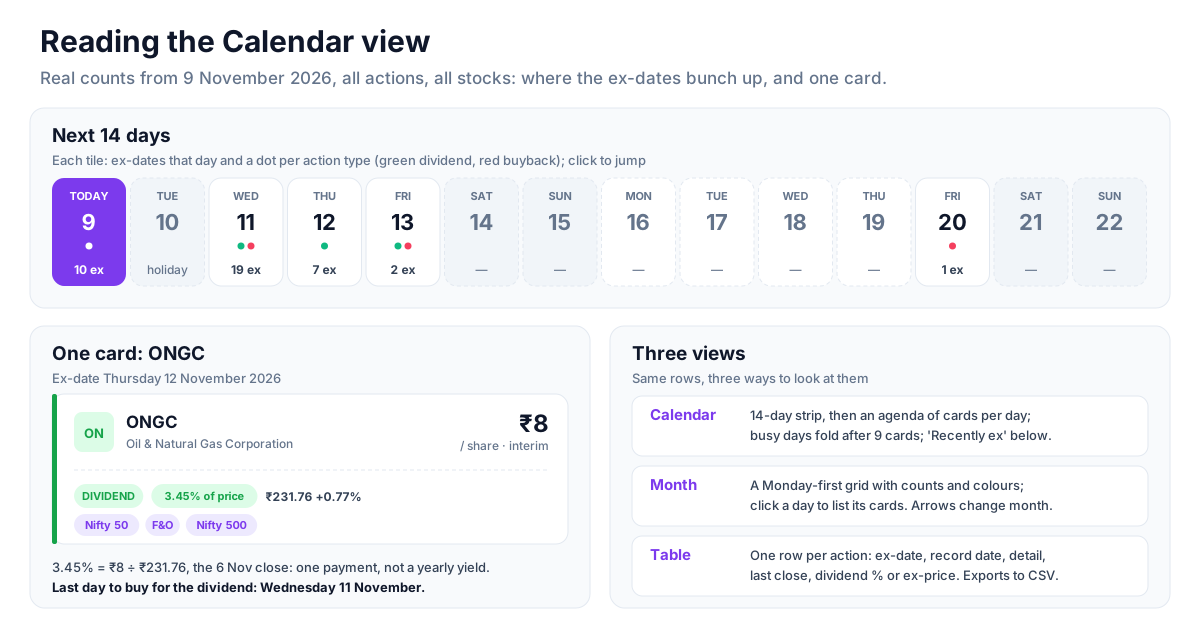
- Ex-date: Thursday 12 November, record date the same day.
- Detail: Interim dividend of ₹8 per share.
- Last close: ₹231.76 (6 November), up 0.77% that day.
- 3.45% of price: ₹8 ÷ ₹231.76. This is the "Biggest dividend ahead" tile, which looks at companies only (InvIT and REIT payouts are left out because they pay out most of their cash by design).
- Tags: Nifty 50, F&O, Nifty 500.
3.45% is one payment against one day's price, not an annual yield. ONGC pays more than once a year, so its yearly yield is a different number; the Dividend Tracker is the page for that.
NAVNETEDUL: two dividends on one line
NSE's subject line reads "Special Dividend - Rs 1.50 Per Share / Interim Dividend - Rs 1.50 Per Share". The page adds every dividend it names, so the card shows ₹3 / share, interim + special, 2.32% of the ₹129.32 close. It goes ex on 11 November, so like CHAMBLFERT the last day to buy was 9 November.
CONCORDBIO: a bonus that has already happened
CONCORDBIO's 1:1 bonus went ex on 4 November. Every holder on the record date got one new share for each share held, and the theoretical ex-price was half the previous close. Because the ex-date is earlier than the last close the page has (6 November), the card shows no ex-price: that adjustment is already in the price. For a bonus or split still ahead, the card shows "ex ≈ ₹…", the last close run through the formula above.
Index giants that went ex last week
- INFY: ₹26 interim, ex 3 November, 2.20% of the price.
- COALINDIA: ₹10.25 interim, ex 4 November, 2.56%.
- NTPC and POWERGRID: ₹3 interim each, ex 6 November.
These sit under "Recently ex", greyed slightly, so you can check whether a drop you saw on one of those mornings was the dividend coming off and not selling.
How to use it in a trade
Before you buy
- Check the strip for your stock. If it goes ex tomorrow and you buy today, you get the dividend; buy tomorrow and you do not. Count trading sessions, not days: a holiday moves the last day to buy back.
- Do not buy only for the dividend. The price tends to open lower by about the dividend on the ex-date, and dividends are taxed at your slab rate. A dividend "captured" this way is usually given back on the open, minus tax.
- Know the tax side. Since April 2020 dividends are taxed in your hands, and the company deducts TDS above ₹10,000 a year for resident individuals.
If you hold options or futures
NSE adjusts F&O contracts (strike, lot size and futures price) for bonuses, splits and rights, and for dividends only when they are large enough to count as extraordinary under SEBI's rules. Smaller dividends are not adjusted: the share price drops on the ex-date and the contract stays as it is. That is why the F&O tag matters on a card. A dividend ahead on an F&O stock that will not be adjusted is already in the futures price (a lower fair value) and in call and put premiums. For a large one, check NSE's F&O circular for the stock to see whether contracts will be adjusted.
Around bonuses and splits
- Stops, alerts and price levels set before the ex-date need to be scaled by the same factor, or they fire on the adjustment.
- Charts and scanners that are not adjusted will show a false gap down. Unfluke's scanners adjust daily bars for splits and bonuses; a broker chart may not.
- Liquidity often changes: a split lowers the price per share and can bring in smaller buyers.
A daily routine
- Open the page in the Calendar view on the default window, and scan the strip for the next 14 days.
- Filter the Universe to the Nifty 50 or F&O if you only trade those, or to your watch list's universe.
- Use the Action chips (Dividend, Bonus, Split, Rights, Buyback, Demerger) to narrow it; each chip shows its count.
- Read "Recently ex" to explain any gap down you see at the open on stocks you hold.
Strategy ideas (ideas, not promises)
- Hold through, don't chase: if you already hold a stock for its own reasons, the calendar tells you when cash or shares are due. Buying only for a dividend rarely works after the ex-date drop and tax.
- Exclude ex-dates from gap scans: a stock that opens 3% lower on the morning its 3% dividend goes ex has not gapped down. Check this page before trading a gap.
- Watch the run-up to bonus and split ex-dates: some traders study how stocks behave between announcement and ex-date, when retail interest can rise. Backtest it before trusting it; the effect, if any, varies.
- Buyback record dates: in a tender-offer buyback, small shareholders get a reserved share of the offer. The record date is the day you must hold by. The acceptance ratio decides how much you can tender at the buyback price, and the rest stays exposed to the market.
- Options around F&O dividends: a dividend that NSE does not adjust for lowers futures fair value and call premiums before the ex-date. Compare a stock's futures basis before and after its ex-date to see it.
These are ideas to study, paper-trade and backtest, not recommendations or signals, and not a promise of any result. Corporate action dates can change; the company's exchange filing is the final word. Size, entries, exits and risk are your own decisions.
Every view, filter and field
The three views
- Calendar (the default): a strip of the next 14 days, each tile showing how many actions go ex that day and a coloured dot per action type; click a tile to jump to it. Under the strip, the "Upcoming" agenda lists each day with a calendar-leaf date and a card per action. A busy day shows 9 cards and a "Show all" button. Then comes "Recently ex", newest first; on the default window it shows the last 3 days and folds the rest behind "Show earlier days".
- Month: a Monday-first month grid. Each day shows how many actions go ex and their colours; click a day to list its cards under the grid. The arrows move a month at a time, and the page fetches that whole month, so you can look back months.
- Table: one row per action, for scanning and for the CSV: Ex-Date, Symbol, Action, Detail, Record Date, Last Close, and Dividend % / Ex-Price. On a phone the rows become cards.
The filters
- Window (Calendar and Table views): Last 7 + next 30 days (default), Upcoming (next 60 days), Last 30 days, Last 90 days, or Last 12 months.
- Action: All, Dividend, Bonus, Split, Rights, Buyback, Demerger, each with its count in the window.
- Universe: All, or a Watch List universe such as the Nifty 50, Nifty Next 50, Nifty Bank, F&O or Nifty 500.
- CSV: every row in the window, with NSE's original subject line, the parsed detail and the index tags.
The summary tiles
- Upcoming ex-dates, with the number already ex in the window under it.
- Dividends and Bonus & splits in the window, on the filters picked.
- Biggest dividend ahead: the upcoming company dividend that is the largest share of its price (InvITs and REITs excluded).
On each card
- The headline figure: ₹ per share (or per unit for an InvIT or REIT) and the kind (interim, final, special); the bonus ratio; the face-value change of a split; the rights ratio.
- % of price for a dividend: the dividend ÷ the last close. One payment, not an annual yield.
- ex ≈ ₹… for a bonus or split still ahead: its theoretical ex-price.
- Last close and day change, the record date if it differs from the ex-date, and index tags (Nifty 50, F&O, Nifty 500).
- Hover a card to read NSE's full subject line.
Where the dates come from
The actions are NSE's corporate-action announcements for equity (EQ and BE series), SME, InvIT and REIT securities; bonds and government securities are left out. Amounts, ratios and face values are read from NSE's subject line; a subject the page cannot parse still appears, with the subject as its detail. Prices are the latest Bhavcopy close, so on a Monday they are Friday's. NSE publishes an action once the company fixes its record date, usually one to three weeks ahead, so a dividend a company has only hinted at is not on the calendar yet. The page says how far ahead it currently reaches. Always confirm a date against the company's own exchange filing before acting on it.
Where to go next
For the wider corporate-actions picture, read the corporate actions guide; for a company's dividend record over years, the Dividend Tracker guide; and for the other dates that move stocks, the Result Calendar guide and the Lock-in Expiry Calendar guide. Open the page at Calendars & Reference → Dividend & Bonus Calendar, or sign up free.
More from the blog
- Strategy Backtesting on Unfluke
Backtest trading strategies on real Indian market data with Unfluke. Test equity, Nifty, Bank Nifty and options strategies with realistic costs and key metrics.
- Live Market Scanners
Explore Unfluke's real-time stock scanner for NSE markets. Scan 1,800+ stocks with 40+ technical indicators, fundamental filters, F&O data and custom rules.
- Option Strategy Simulator
Build and simulate multi-leg options strategies with Unfluke. Visualize payoffs, Greeks, max profit and loss, and replay historical option data from 2023.