Market Terminal
Gap Scanner: Which Opening Gaps Filled, and How Often Each Stock's Gaps Fill
12 min read · Updated 9 Nov 2026
"Gaps get filled" is one of the oldest sayings in trading, and like most sayings it is half true. Some stocks trade back to the previous close within hours of almost every gap. Others gap and keep going for weeks. The question that matters is not whether gaps fill in general, but whether this stock's gaps of this size usually do.
The Gap Scanner answers that for every liquid NSE company that opened 1% or more away from its previous close. It shows whether the gap filled during the day, and how often the stock's own past gaps of a similar size filled the same day, within five sessions and within twenty, over about three years. This guide explains the rules, reads real rows from 6 November 2026 (GLENMARK, MARINE, SCHNEIDER and a few traps), and turns them into a plan. For what a gap is and how gap-ups and gap-downs behave during the day, start with the Gap Up / Gap Down guide; this page adds the history.
What a gap and a gap fill are, and the stock's own history
The gap
A gap is the distance between the day's open and the previous session's close:
Gap % = (today's open − previous close) ÷ previous close × 100
The previous close is adjusted for splits and bonuses, so a 1:2 split does not read as a 50% gap down. The page lists gaps of at least 1% by default, and you can raise the bar to 2%, 3% or 5%.
The fill
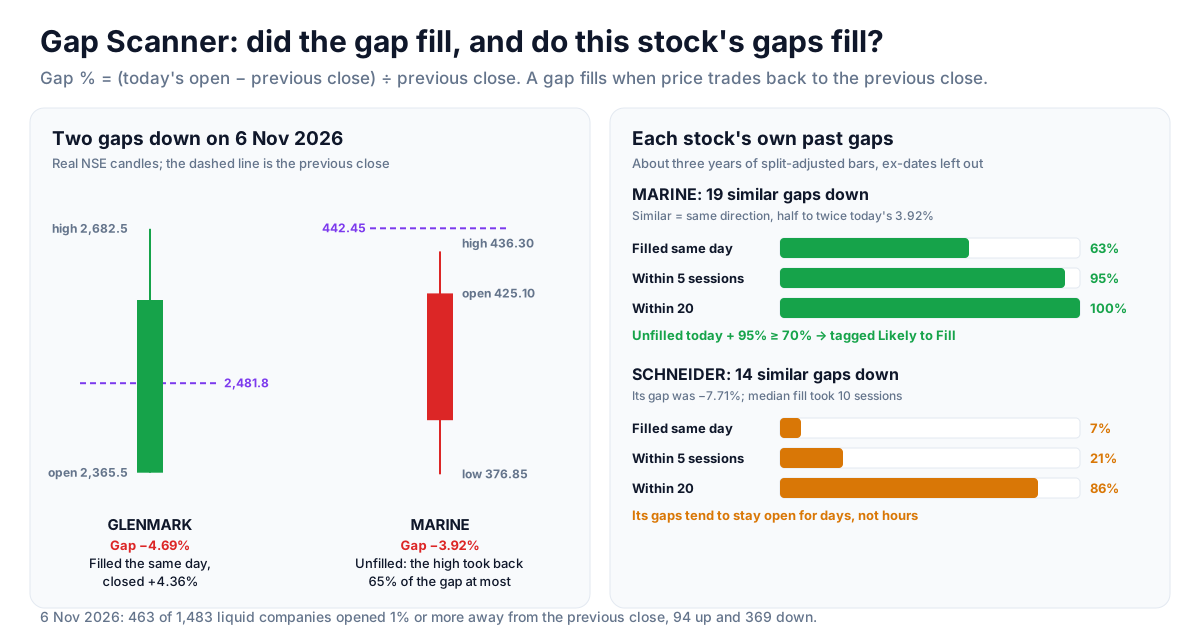
A gap fills when price trades back to the previous close: for a gap up, the day's low reaches it; for a gap down, the day's high reaches it. The previous close is the fill level. When the day did not fill, the page shows how much of the gap it took back at most. MARINE opened at 425.10 against a previous close of 442.45, a gap of 17.35 rupees; its high of 436.30 was 11.20 above the open, so the day took back 65% of the gap.
The stock's own fill rates
This is what makes the page different from a plain gap list. For every stock that gapped, it reads about three years of split-adjusted daily bars and finds every past gap of 1% or more. It then keeps the ones like today's:
- Same direction: today's gap down is compared with past gaps down.
- Similar size: between half and twice today's gap. For a −3.92% gap, past gaps down of 1.96% to 7.84%.
- At least 8 of them. With fewer than eight similar gaps, the page uses every past gap in the same direction instead and labels the count "all" rather than "similar".
For those gaps it counts how many filled the same day, within 5 sessions and within 20 (the gap day counts as the first session), and the median number of sessions the filled ones took. A gap from last week that has not filled yet cannot say anything about a 20-session rate, so recent gaps are only counted over the horizons they have had time for.
What is left out of the history
- Ex-dates. On the day a dividend, bonus or split goes ex, the stock opens away from the previous close by construction. Those days are not gaps and are not counted.
- Days after a trading break of more than ten calendar days, such as a suspension.
Which stocks are scanned
Companies only (no ETFs or funds, which open wherever their underlying market or creation flows put them), with a 20-session average turnover above ₹1 crore. India only: crypto trades round the clock, so a day never opens away from the previous close.
Reading real rows: 6 November 2026
On 6 November 2026, 463 of the 1,483 liquid companies opened 1% or more away from their previous close: 94 up and 369 down. A morning with four gaps down for every gap up is a market-wide event, and the individual rows should be read with that in mind.
GLENMARK: a gap down that filled and reversed
- Gap −4.69%: opened at 2,365.50 against a previous close of 2,481.80.
- Today: Filled. The day's high of 2,682.50 went well past the fill level. GLENMARK closed at 2,590, up 4.36%, on 7.98× its average volume, and the high was a new 52-week high.
- History: 34 past gaps down (fewer than 8 were similar in size, so the basis is "all"): 65% filled the same day, 79% within 5 sessions, 88% within 20.
Once a gap has filled, there is no gap trade left. What is left is a reversal day: a stock that opened sharply lower and closed sharply higher on heavy volume. That is a different idea, and GLENMARK appears on the Volume Shockers page that day for the same reason.
MARINE: unfilled, and tagged Likely to Fill
- Gap −3.92%, opened at 425.10 against 442.45.
- Today: 65% taken back. The high of 436.30 came close but did not reach the fill level, and the stock closed at 391.30, well below its open.
- Fill rates: 63% same day, 95% within 5 sessions, 100% within 20, from 19 similar past gaps down.
- Tags: Gap down, Unfilled, Likely to fill (unfilled today, at least 8 similar gaps, and 70% or more filled within five sessions).
The history says this stock's gaps of this size have nearly always filled within a week. The day itself says the opposite: it closed 8% below its open, so the fill level is now 13% above the close. Likely to Fill is a statement about the past, and the tag does not know about the day's selling. That is the job of the chart.
SCHNEIDER: a stock whose gaps stay open
- Gap −7.71%, unfilled, 53% taken back at most.
- Fill rates: 7% same day, 21% within 5 sessions, 86% within 20, from 14 similar gaps; median fill 10 sessions.
SCHNEIDER's similar gaps did fill eventually, but rarely quickly. Anyone trading a quick fill here would be betting against the stock's own record. The 20-session rate matters more than the same-day rate for a stock like this.
Three traps on the same day
- CRIZAC, −5.89%, tagged Ex-date: its ₹4 interim dividend went ex that day. On a stock near ₹161, about 2.5 points of the gap is simply the dividend leaving the price.
- MTARTECH, −5.00%, tagged Likely to Fill: its open, high, low and close were all 5,448.50, on 0.08× its usual volume. It was locked at its lower price band all day. Its history says gaps like this fill, but on the day nothing could trade back to 5,735.
- KUSUMGAR, −3.76%, rates of 100%: from only 4 past gaps (basis "all"). Four is far too few to mean anything, which is why it is not tagged Likely to Fill.
How to use it in a trade
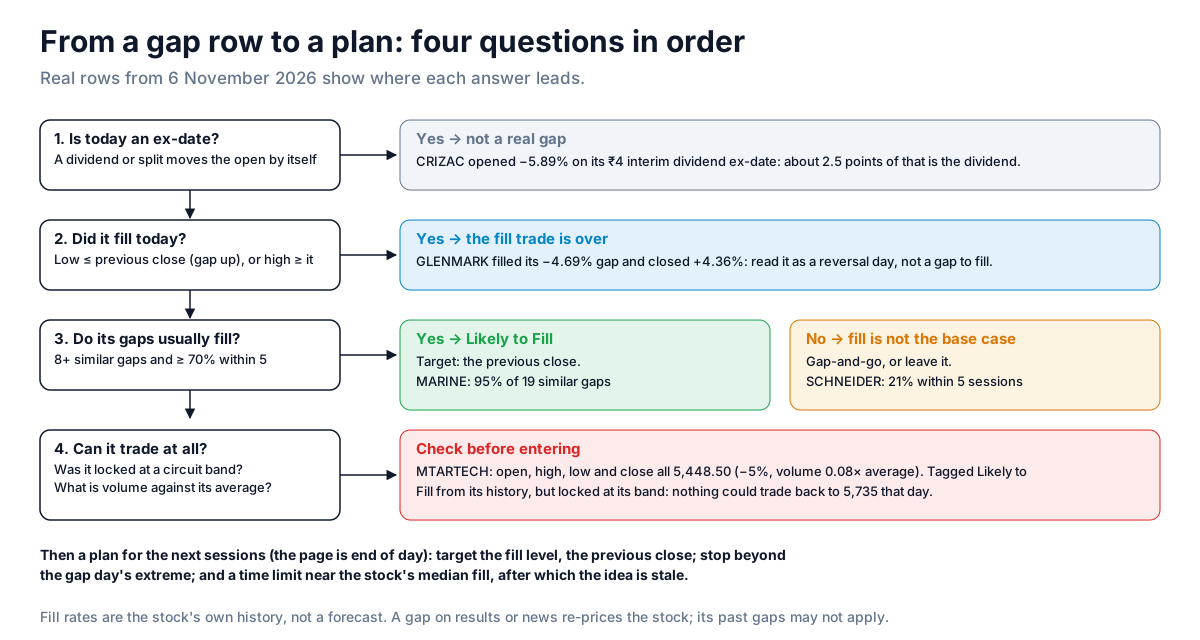
The page is end of day, so a plan from it is for the next sessions. A step-by-step way to get there:
- Throw out ex-dates. A row tagged Ex-date opened lower because a dividend or a bonus left the price. It is not a gap in the trading sense.
- Separate filled from unfilled. Use the Unfilled tab. A gap that filled on the day has nothing left to fill; read its close against its open instead.
- Read the history, and its size. Look at the Past Gaps column first. "19 similar" is a history; "4 all" is an anecdote. Then read the three rates together: a stock with 21% within 5 but 86% within 20 (SCHNEIDER) fills slowly, if at all.
- Find the reason for the gap. A gap on results, a large order or a regulator's action re-prices the stock, and its history of ordinary gaps may not apply. Check the Result Calendar and the filings for the day.
- Check that the stock could trade. A stock locked at its circuit band (open, high, low and close the same) has nothing to tell you about fills that day. Volume against its average (the Vol Ratio column) says how much conviction was behind the gap.
- Write the plan in the page's terms. Target: the fill level (the previous close, drawn on the chart). Stop: beyond the gap day's extreme, its low for a gap down that you expect to fill upward. Time limit: around the stock's Median Fill; if it has not filled by then, the reason for the trade has gone.
Strategy ideas (ideas, not promises)
These are ideas to study, paper-trade and backtest, not recommendations or signals, and not a promise of any result. A stock's past fill rate is a history, not a forecast, and a gap on news can stay open for good. Size, entries, exits and risk are your own decisions.
1. Likely to Fill, with a close that agrees
- Setup: a Likely to Fill row (8+ similar gaps, 70%+ within 5 sessions), no ex-date, no results or major news that day, and a close in the upper half of the day's range for a gap down (the lower half for a gap up).
- Entry idea: the next session, towards the fill level.
- Exit: at the fill level. Stop: beyond the gap day's extreme. Time stop: five sessions.
- Note: MARINE on 6 November had the history but not the close (it ended 8% below its open), so this idea would wait.
2. Gap-and-go: the stocks whose gaps do not fill
- Setup: an unfilled gap of 2% or more, a 5-session fill rate of 30% or less from 8+ similar gaps, volume at least 2× average, and a close beyond the open in the gap's direction.
- Idea: treat the gap as the start of a move, not something to fade; the gap day's open is the line that should hold.
- Invalidation: a close back through the open, towards the fill level.
3. The market-wide gap day
- Setup: a day like 6 November, with gaps down outnumbering gaps up by three to one or more.
- Idea: on such days individual histories matter less than the market. Compare the next sessions' fill rate of the day's Likely to Fill rows with their history; if they fill much less often on broad gap days, add a breadth filter (the Market Breadth guide shows how to read the day).
4. A filter for other scans
- Idea: before buying a breakout from another scanner, check whether the breakout day was a gap and how this stock's gaps of that size usually behave. A breakout that arrived on a gap with a 90% same-week fill rate is likely to be tested.
How to test these
Signed-in users can step back through past sessions with the date box. Record each row that met an idea's setup and whether it reached the fill level within the time stop, before or after the stop. Include costs: a gap trade aims for a small move, so brokerage and slippage are a large share of it. Backtest the rules on Unfluke before trading real money.
Every tab, filter and column
The tabs
- All Gaps: every gap at or over the chosen size, biggest first.
- Gap Up: opened above the previous close, biggest first.
- Gap Down: opened below the previous close, biggest first.
- Unfilled: the day never traded back to the previous close.
- Likely to Fill: unfilled today, with at least 8 similar past gaps of which 70% or more filled within five sessions; highest five-session rate first.
The count above the table reads, for example, "463 listed · 94 gapped up, 369 down of 1,483 stocks".
The filters
- Gap at least: 1% (the default), 2%, 3% or 5%.
- Session date: the newest session by default; signed-in users can pick an earlier one.
- Universe: All, Nifty 50, Nifty Next 50, Nifty Bank, F&O or Nifty 500.
- Export CSV: the rows on screen.
The columns
- Symbol, LTP, Sector: the stock, its close and change, its broad sector.
- Gap: the open against the previous close.
- Today: Filled, or how much of the gap the day took back at most.
- Fill Same Day, Fill ≤5D, Fill ≤20D: the share of the stock's similar past gaps that filled on the gap day, within five sessions and within twenty. Highlighted at 70% or more, dimmed at 30% or less.
- Past Gaps: how many past gaps the rates come from, "similar" (half to twice today's size, same direction) or "all" (every gap that way, when fewer than 8 are similar).
- Median Fill: the sessions the filled gaps took, middle value; "same day" for 0.
- Vol Ratio: the day's volume ÷ the average of the 20 sessions before it.
- Signal: Gap up, Gap down, Unfilled, Likely to fill, Ex-date.
- 5 Days: the last five daily candles.
- Chart: daily candles with the fill level (previous close) drawn across, the gap day marked, and the rates, sample and history start date.
What the numbers are built from
Everything is end of day, from NSE's daily Bhavcopy (the EQ series). The previous close and the three-year history are adjusted for splits and bonuses. Ex-dates come from NSE's corporate-action records; every ex-date in the history is skipped, and a gap on today's ex-date is listed but tagged. A past gap's "sessions to fill" counts trading sessions from the gap day (0 = the same day). The history starts about three years before the scanned session, or at the stock's listing if later, which is why a recent listing has few past gaps. Fill rates are rounded to whole percent.
Where to go next
For how gap-ups and gap-downs behave during the session, read the Gap Up / Gap Down guide; for the volume behind a move, the Volume Shockers guide; for gaps on results, the Results Reaction guide; and for the opening auction that sets the gap, the pre-open session guide. Open the page at Watch List → Gap Scanner, or sign up free to run it on past dates.
More from the blog
- Strategy Backtesting on Unfluke
Backtest trading strategies on real Indian market data with Unfluke. Test equity, Nifty, Bank Nifty and options strategies with realistic costs and key metrics.
- Live Market Scanners
Explore Unfluke's real-time stock scanner for NSE markets. Scan 1,800+ stocks with 40+ technical indicators, fundamental filters, F&O data and custom rules.
- Option Strategy Simulator
Build and simulate multi-leg options strategies with Unfluke. Visualize payoffs, Greeks, max profit and loss, and replay historical option data from 2023.